Budget and Forecast Manager
Navigate to Budgeting & Forecasting > Budgeting > Budget & Forecast Manager.
Most of the budgeting data displays in grids. You can copy between spreadsheets to easily edit data. There are some general rules for the grid operation.
- Data is not saved to the database until the grid is filtered you click Save.
- Data can be copied from the grid to a spreadsheet. Right-click on the grid, select Copy the Table and then paste into a spreadsheet.
- Actual data cannot be edited and is shown in blue.
- Editable records in the grid go into edit mode when you click the record. You can enter data directly into these editable fields or a range of data can be pasted from a spreadsheet. To paste a range of data, right-click the top left cell for the paste and select Paste.
- Some grids show edited records in red.
-
Data in italics cannot be edited (determined by the Branch/Sites, and/or Cost Centres defined in your User Account).
Buttons above the grid
| Budget System Task Status | Shows Budget System Task Statuses ordered by Requested Time, with the earliest at the top, |
| Calculate Budget | Recalculates the Budget in the background. Any other users who have made changes to this Budge will lose their changes. |
| Export Budget | Displays the Budget Export Wizard where you can create Export files. |
| Copy Budget | Copies the selected Budget and creates a new budget from it. |
| Add New Budget | Lets you create a new Budget. |
| Edit Budget | Opens the Budget Header Manager. |
| Delete Budget | Deletes the selected Budget. |
Create a budget
The steps to creating the budget include:
- Set up all equipment (real and modelling) in AMT. Equipment is correctly set up in AMT when:
- Equipment term and expected usages are confirmed.
- Availability parameters are confirmed.
- Work order settlements are imported and correctly linked and cleansed.
- Strategy is maintained to show correct expected change outs.
- All future (modelling) equipment is set up with expected purchase prices and purchase dates.
- Set up all overheads in AMT using Overheads Navigator.
- Set up a budget scenario in Budget & Forecast Manager.
- Import selected equipment and overheads into the Budget & Forecast Manager.
To create a budget, click Add then
-
Enter a Scenario Name.
-
Enter a Version Number.
-
Select a Budget Type.
-
Select a Year.
-
Select a Start Month.
-
The End Month will be automatically updated based on the Period associated to the Budget Type selected.
-
Budget Types and their associate budget periods are defined in the Budget Type system table.
-
-
Adjust the End Month (if required).
-
Select a Currency.
-
All costs imported into the budget will be converted into the budget's currency.
-
-
Select a Message Group.
-
The AMT users associated to the Message Group will receive emails every time the budget's status is updated.
-
Message Groups are defined in the Message Group function.
-
After clicking Create New Budget, AMT creates a system task to import the equipment into the budget and place it into a queue. To see your budget’s place in the queue, navigate back to the Budget & Forecast Manager screen and click Budget System Task System  .
.
A failed budget system task is automatically re-run up to three times. If it fails after three attempts the task is abandoned, and a record is written into the AMT BUDGET_ERROR table.
The data imported into a budget is a one-off snapshot of AMT’s core data. Changes which occur in core AMT do not automatically update the budget. Changes in the core environment can be updated or reflected in the budget using the Advanced Update Routines.
The My Equipment filter and My Cost Centre filter, which appear on different budget module screens, are linked to your User Account. If you view equipment or cost centres which are not set up in your User Account, the data in the grid will show in italics and cannot be changed.
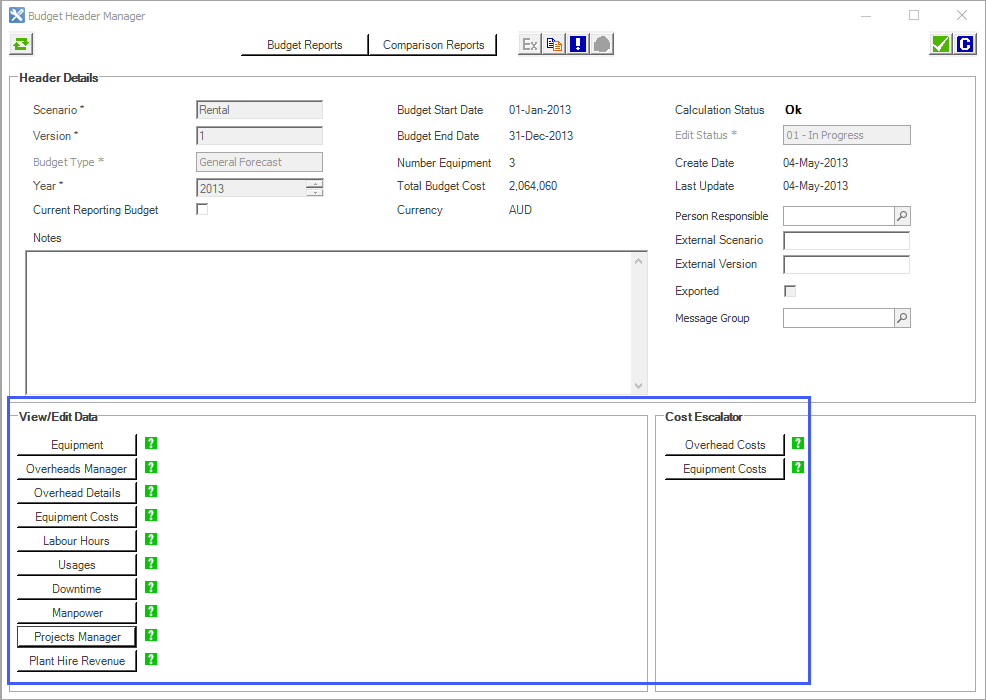
Once the budget is created, the following functions, which are at the bottom of the Budget Header Manager screen, can be used to view and modify the historical costs or changes to the budget strategy.
Equipment
Equipment enables you to add or remove Real and Modelling equipment from the budget.
When adding equipment, the Equipment Filters section determines which equipment can be added (based on the user’s Branch/Site permissions set up in their User Account). The Cost Filters section, including cost centre activity, location, and responsibility, then refines which specific cost data, from the selected equipment, are imported into the budget. For example, for the equipment selected, “Asset#123”, only import strategy task costs linked to expense element “Gaskets”.
Eqp Cost Centre is the cost centre at the equipment level. Cost Centre is the cost centre at the strategy task level.
The equipment imported can be viewed in the Budget Manager grid.
-
Start Date - equipment life cycle start date (which cannot be changed).
-
End Date - initially the equipment’s life cycle end date from the source projection but can be changed.
-
%RVIC - RVIC of the equipment at the end of the budget period.
-
Opt. End Period - AMT calculates the Optimal End Period (termination or sell date) if the RVIC is lower than the existing End Date’s RVIC (+/- 12 months).
-
Total Costs - equipment costs within the budget’s start and end dates.
Once the equipment is imported into the budget, attributes of the equipment itself can be edited if required.
-
Model/Equipment - these values should not be changed in order to maintain the link between the equipment in budgeting and the source equipment in core AMT. Equipment Name must be unique in the budget.
-
Replaces Equipment - which equipment (if any) this specific equipment will replace.
-
Purchase Price - can be added if the equipment is purchased during the budget period. This information will appear on the Budget Summary, Capital Forecast and Capital Purchases Forecast report.
-
New - Modelling equipment added to a budget will be flagged automatically by AMT as New, but this can be toggled by the user for any equipment type.
-
Termination Date - date on which the equipment will be terminated. If this date is extended, the End Date of the equipment must be extended in core AMT and the equipment re-imported into the budget.
-
Optimal Termination Period - information provided automatically by AMT, where AMT automatically calculates the termination period.
-
Estimated Sell Price - value used in the Capital Forecast and Budget Summary reports.
-
Scheduling Efficiency - used to adjust Budgeting’s Availability Forecast. Must be between 0-100%.
-
Cost Margins – only relevant to equipment configured as MARC, and is used to calculate Cost at Cost for part, labour and misc. for costs manually added to the budget.
-
Ignore Budget Costs for the Equipment - exclude the equipment in budget cost reports.
Overheads Data
Overheads Data allows you to import an overhead projection and actuals from the core of AMT into the budget. The Budget module is designed to import Modelling Overheads and Real Overheads.
To import an overhead projection, the overhead projection must exist in the core of AMT.
Multiple overhead projections can be imported into a single budget.
Overhead Details
Overhead Details enables you to view actual and future overhead costs and modify future overhead costs in an overhead projection.
Actual costs values are coloured blue. Values entered manually are coloured red until the data is saved, then they will return to normal. Data within the grid can be exported to an external spreadsheet program, modified, then copied and pasted back into AMT. Actual data will not be overwritten.
If you are having problems pasting data back into AMT, ensure you are pasting into a future month.
You can add additional overhead cost categories into the projection by clicking the Add button, as long as the overhead cost category already exists in the imported overhead cost projection. This inserts a new row into the overhead projection, which you can then edit.
As with all changes in budgeting, modifications made to forecasted values will not update the source overhead projection in the core of AMT.
Equipment Costs
Equipment Costs enables you to view actual and future equipment costs and modify future equipment costs and modify future equipment costs.
The grid groups costs are based on a combination of
-
Equipment
-
Component (Strategy Task)
-
Work Group
-
Expense Element
-
Cost Bearer
-
P (parts)/L (labour)/M (miscellaneous)
Use the Display Fields filter to add additional grouping fields.
Actual costs values are coloured blue. Values entered manually are be coloured red. Data within the grid can be exported to an external spreadsheet program, modified, then copied and pasted back into AMT. Actuals data will not be overwritten.
If you are having problems pasting data back into AMT, ensure you are pasting into a future month.
Use filters to narrow focus on strategy tasks to be changed, rather than showing everything.
A special editor is also available for changing the projected occurrences of a strategy task. To trigger this editor, right-click on the row of the strategy task and select Edit Occurrences.
Cost Occurrence Manager also provides a facility to add additional costs for a completely new type of cost, for example, creating a one-off refurbishment cost (basically any cost to the equipment that will occur in the budget period, which is not already costed in existing strategy tasks or as an overhead). The Add button on the screen allows you to add such a cost.
The Component (strategy task) options are limited to those available in the source projection of the equipment. Keep in mind that the way the cost is added and coded in the budget should ideally reflect how the actual costs will be reflected in AMT when the actual cost is incurred. This will maintain an “apples with apples” comparison when running reports.
Comments can be recorded on a specific cell in the grid by right-clicking and selecting Comments. Along with the comment, AMT captures the date and time of the comment, and the user who entered the comment.
Risk Override values can be entered manually on tasks in the grid.
The Risk Override value entered applies to the entire task, not specific parts/labour/misc costs of the task or single occurrences of a task.
Manual changes made to costs do not update the budget's labour hours or downtime data.
The Cost Occurrence Manager also has a Financial Code multi-editor grid, allowing for batch modifications of financial codes of imported tasks, and simplifiying financial reassignments, improving the efficiency of budget adjustments.
You can easily adjust critical financial codes such as Cost Centre, Cost Bearer, and Expense Element.
As with all changes in budgeting, modifications made to forecasted values will not update the source projection in the core of AMT.
Labour Hours
Labour Hours enables you to view the labour hours associated with strategy tasks forecasted in the future.
Actual labour hours values are coloured blue. Values entered manually are coloured red. Data within the grid can be exported to an external spreadsheet program, modified, then copied and pasted back into AMT.
Manual changes made to labour hours do not update the budget's cost, actual occurrences or downtime data.
Changing the labour hours on a given task can automatically change the associated labour costs and vice versa, keeping labour rates consistent.
You can Refresh Labour Rates, which enables you to update labour rates that might have changed on AMT live, changing the associated costs for selected assets.
A warning message alerts you about the potential impact on labour costs before proceeding.
As with all changes in budgeting, modifications made to forecasted values will not update the source projection in the core of AMT.
Usages
Usages enables you to view actual and future equipment usages and modify future equipment usages.
For equipment configured for Simple Utilisation, projected usages per month shown in the grid is derived from the equipment’s Annual Utilisation assumption. For equipment configured for Advanced Utilisation, projected usages per month shown in the grid is derived from the Usage Profile linked to the equipment.
Actual usage values are coloured blue. Values entered manually are coloured red. Data within the grid can be exported to an external spreadsheet program, modified, then copied and pasted back into AMT. Actual data will not be overwritten.
If you are having problem pasting data back into AMT, ensure you are pasting into a future month.
As with all changes in budgeting, modifications made to forecasted values will not update the source projection in the core of AMT.
Usage Profile relationships imported for the live AMT environment are not maintained in Budgeting. Rather, AMT takes the forecast of usages per UOM from the Usage Profile, and replicates that forecast per UOM in Budgeting. If you change a Parent UOM in Budgeting, there is no cascade down to Child UOMs. You have to make the changes to other UOMs separately.
If you increase forecast usage rates significantly, this may cause future budget periods to forecast no cost. Remember, the budget module takes a snapshot from core AMT for the defined budget period when the budget is first created. The budget module does not take another snapshot to “back fill” future months due to increased utilisation. There are two reasons for this:
1. The budget module does not snapshot all the underlying core AMT parameters required to re-forecast future occurrences accurately (for example, strategy task frequencies, advanced scheduling logic, manual next occurrence changes, and so on.). Only the forecast produced by core AMT based on these parameters is snapshotted.
2. Mixing core future costs with a budget snapshot costs will result in an inaccurate budget. For example, an occurrence of a strategy task forecast originally in May (when the budget snapshot was created) might now in core be forecast in September. Back-filling September into a budget will result in the occurrence being budgeted twice: once in May and once in September.
If a significant change to an equipment’s forecast usage is required, this change should be made in core AMT. This allows AMT to recalculate ( that is, re-forecast) future strategy task occurrences, which can then be reimported into a budget (by adding the equipment to the budget).
Downtime
Downtime enables you to view the downtime associated with strategy tasks forecasted in the future. This enables budgeting to produce Availability Forecast reports.
For Availability Forecasting, budgeting draws on the following data.
-
Estimated durations per strategy task (source: projections imported into the budget).
-
Scheduling Efficiency % (source: equipment details in the budget).
-
Baseline Downtime (source: availability parameters per fleet set up using the Fleet Administration function).
Values entered manually are coloured red. Data within the grid can be exported to an external spreadsheet program, modified, then copied and pasted back into AMT.
Manual changes made to downtime do not update the budget’s costs or labour hours data.
As with all changes in budgeting, modifications made to forecasted values will not update the source projection in the core of AMT.
Actual durations (historic data) is not imported into budgeting.
Manpower
Manpower enables you to manually create a manpower (that is, headcount) forecast in AMT. AMT does not automatically calculate a manpower forecast from strategy tasks or any other source. It is entirely up to the user to create a manpower forecast here in budgeting if required, or to copy a manpower budget from another budget.
The manpower forecast is based on the following codes.
-
Cost Centre
-
Labour Activity
-
Movement Type
-
BL: Baseline
-
NH: New Hire
-
PI: Promotion In
-
PO: Promotion Out
-
TR: Termination
-
A row in the grid is based on the combination of the above three codes. Values entered manually are coloured red until the data is saved, in which case it will return to normal. Data within the grid can be exported to an external spreadsheet program, modified, then copied and pasted back into AMT.
Multiple rows in the grid can be created at once by selecting multiple Movement Types
Manpower data does not relate to other budget data such as labour hours.
Projects Manager
Only relevant to equipment configured as Plant Hire.
Projects Manager enables the user to view Projects to which Plant Hire equipment are linked. Project linkages created in the core of AMT are visible here and cannot be changed.
The Replace Equipment Plant Revenue Details button triggers the revenue for listed projects to be recalculated based on usage adjustments made within the budget. This process does not draw on plant rate schedule data from core AMT. Plant rate schedule data is imported into budgeting when the equipment is first added to the budget.
If changes have been made to the plant rate scheduled in core AMT, and you want the budget to reflect these changes, the equipment must be deleted from the budget and re-added. The delete process deletes all data relating to the equipment in budgeting (that is costs, downtime, usages and so on).
Plant Hire Revenue
Only relevant to equipment configured as Plant Hire.
Plant Hire Revenue contains the forecast monthly revenue by equipment, plant rate schedule, cost centre and expense element.
Actual revenues are coloured blue. Values entered manually are coloured red. Data within the grid can be exported to an external spreadsheet program, modified, then copied and pasted back into AMT. Actual data will not be overwritten.
Overhead Costs/Equipment Costs
Escalations (cost adjustments) can be made to a budget. However, these adjustments only apply to the projected costs. Escalations to Equipment or Overheads can applied through the respective Cost Escalator functions, accessed on the Budget Header Manager screen.
Escalation rules
-
Once applied, the escalation is not reversible unless you apply an appropriate percentage to achieve a reversal.
-
Multiple escalations can be applied, so after applying one set of escalations, another can be applied at a different rate to other periods of time, resulting in a cumulative escalated result. Notes should be made to record the different adjustments made.
-
Escalations apply to costs only.
-
Escalations do not impact Plant Hire revenue data of equipment configured for Plant Hire.
Changing budget status
The status of a budget can be changed. However, budget status permissions, defined in a User Account determines whether a user can change a budget status, and which statuses can they change. For example, a user may be able to change an In Progress budget to Under Review, but cannot change the status to Authorised.
Budget status permissions are maintained in User Accounts. The Budget Status workflow is maintained in the Budget Status system table.
Reports
There are two main types of reports - budget reports and comparison reports.
Budget reports – reports on the nominated budget.
Budget Summary
- Budget Summary
Combines equipment, overhead, CAPEX and manpower into one high-level report. - Total Cost Analysis
Analyses actual or projected equipment or overhead costs using common financial codes such as cost centre and expense element. - Total Cost per UOM
Calculates the cost per UOM (for example, cost per hour) for equipment and overheads over a selected time period based on actual or projected costs. - Headcount Forecast
Produces a headcount forecast based directly on the data entered into the Manpower screen. No calculations are performed. - Budget Change History
Lists the audit changes to the budget.
Equipment Details
- Equipment Summary.
Presents a summary of equipment in the budget in terms of fleet population, total cost, average availability, total utilisation and net CAPEX. - Equipment Details
Lists each individual equipment included in the budget along with key attributes. Unlike other reports, this report calculates the RVIC% of the equipment at the end of the budget period, and calculates the Optimal End Date (termination or sell date). Both calculations are for information purposely only. AMT calculates an Optimal End Date if RVIC is lower than the existing End Date’s RVIC (+/- 12 months). - Equipment Numbers
Line graph which illustrates the rise and fall in equipment numbers due to equipment terminations and acquisitions, over the budget period. - Capital Forecast
This report details the equipment which will be purchased as New in the budget period, and the equipment which will be sold. The report calculates total purchases less total equipment sales, as well as suggests the optimal sales point. AMT calculates the optimal sales point by looking at the lowest RVIC point +/- 12 months from the end date.
For an equipment to be considered in this report as a New purchase, it must be flagged as new, have a start date in the Budget period, and have a purchase price. For an equipment to be considered as being sold, it must have an end date in the budget period and a sell price. - Capital Purchase Forecast
Bar chart report which shows the volume of New equipment purchased in terms of purchase value. For an equipment to be considered in this report, it must be flagged as new, have a start date in the budget period, and have a purchase price.
Usages and Availability
- Equipment Usages Summary
Summarises per equipment per month utilisation, downtime hours, availability, RVIC and RVIC%. - Utilisation and Availability Forecast Details
Combination line/bar graph illustrating both utilisation and availability per month over a selected date range within the budget period. - Forecast Availability Analysis
Flexible report to analyse the availability forecast (for example, by equipment per month, by fleet per annum). - Fleet Usage and Availability Summary
Tabular report presenting forecast availability, forecast usage, equipment number and average equipment usage per month/quarter/year.
Equipment Cost Analysis
- Equipment Cost Analysis
Same as the standard AMT Cost Analysis – Life Cycle report which can analyse actual and projected costs. - Changeout Analysis
Same as the standard AMT Changeout Analysis report which can contain actual and projected changeout quantities. - Component Changeout Analysis
Similar to the standard AMT Changeout Analysis – Detailed report, and is more flexible than the Changeout Analysis report
Plant Group
-
Plant Hire P&L
This report is only relevant for Plant Hire equipment. It is the same as the standard AMT Site P&L report for Plant Hire.The CBD calculation logic is relevant if you are using the Plant Hire CBD methodology and not the new Depreciable Assets methodology. The CBD adjustment area of the report is redundant if the Plant Hire methodology is not used.
Some points on the calculation logic in the CBD Adjustment area:
-
CBD Component Depreciation – for future periods this defaults to the same as the Plant Revenue for CBD flagged Expense Elements.
-
Capitalised Component – for future periods this defaults to the same as the component changeout costs (that is Costs for CBD flagged Expense Elements).
-
Forecast CBD Under/Over – This is the difference between the Plant Hire Rate for CBD items and the Current Projection Rate.
Example
Assume an Equipment is forecast to do 5,000 hours per annum and its engine is setup with a frequency of 15,000 and a cost of $150,000. Its plant rate, therefore, is calculated and set at $10 per hour ($150,000 divided by 15,000 = $10/hour).
If at some point in the future the engine strategy task cost is changed to $180,000 and the plant rate is not changed then AMT will calculate the CBD Under/Over amount as:
-
Current Projection average annualised cost
($180,000/15,000 x 5,000) $60,000
-
Plant Rate annualised revenue ($10 x 5,000) $50,000
-
Annual variance $10,000
-
Monthly Variance ($10,000 / 12) $ 833
This follows the ACI logic in AMT, meaning the calculation works regardless of whether the strategy task is Unit of Measure-based or Days-based.
A positive Forecast CBD Under/Over amount indicates CBD components are not being recovered fully by the prevailing CBD component rate. A negative amount indicates component recoveries are greater than component costs, and will reduce the overall plant result.
This is the only report in Budgeting that references “live AMT” in its calculations. Therefore, this report can change from one day to the next, even though the Budget has not changed.
-
-
Profit Loss on Component Disposal – for future periods this is 0.
-
Capitalised Component Adjustment – for future periods this is 0.
-
Component CBD Adjustment – for future periods this is 0.
-
Forecast CBD Over/Under – a positive number indicates CBD components are not being recovered fully by the CBD component rate. A negative number indicates recovery > cost and will reduce the overall plant result (refer to the Plant Hire Handbook for more information).
-
-
Equipment Analysis
This report is only relevant for Plant Hire equipment.This is a flexible report for analysing the equipment numbers by different groupings. You can opt to focus on current equipment allocated to projects or to also include potential future equipment allocated to projects.
-
Revenue Analysis
This report is only relevant for Plant Hire equipment.
This report allows you to analyse a Project’s plant hire revenue per equipment. You can opt to focus on forecast revenue or potential revenue (which incorporates project probabilities).
Comparison reports – compare the nominated budget to other budgets
Budget Summary
- Total Cost Analysis
- Cost Analysis
Flexible report comparing high-level costs (for example, cost centre, expense elements, cost bearer) between two budgets for a specific time period. The report shows the cost per budget and calculates the variance. OH refers to Overheads. - Cost Period Analysis
Similar to the Cost Analysis report but compares the difference between two budgets over time (that is, compares costs per month, quarter, year). - Cost Variance Analysis
Similar to the Cost Period Analysis report but does not show the cost per budget, only the resultant variance per period (that is, month, quarter, year). -
YTS Comparison Report
Compares cost per budget in terms of Month To Date and Year To Date. Year to Date is determined by the Start Date of the report.
- Cost Analysis
Equipment Cost Analysis
- Cost Analysis
Flexible report comparing equipment costs between two budgets for a specific time period. The report shows the cost per budget and calculates the variance. - Cost Period Analysis
Similar to the Cost Analysis report but compares the difference between two budgets over time (that is, compares costs per month, quarter, year). - Cost Variance Analysis
Similar to the Cost Period Analysis report but does not show the cost per budget, only the resultant variance per period (that is, month, quarter, year). - Equipment Cost per UOM
Compares cost, usage and cost per UOM between equipment over a specific time period. - Strategy Task Variance Analysis
Analyses differences in strategy tasks between different budgets in terms of number of occurrences, cost and utilisation. Therefore, if a strategy task will incur more cost in one budget compared to another, this report will identify whether it is driven by changes in utilisation (which may impact occurrences) or early failures or straight cost.