Integration Status Application
The Integration Status application provides users with the capability to monitor and review system integration statuses in AMT with an initial Dashboard.
More specifically it provides:
-
visibility of errors and status of integration from ERP solutions to AMT systems.
-
for Sentinal, where integration is sending information from AMT to ERP solutions:
-
a mechanism to resend failed integration records after the underlying issue has been resolved.
-
a mechanism to acknowledge errors where the underlying error can't be resolved or the record dos not need to be resent.
-
The Dashboard covers the nominated functions subject to configuration in the database table AMT_TYPED_VARIABLE.
| Adapter | Integration Type |
| Assets | Process Asset |
| Process Functional Location | |
| Asset Statistic | Process Usage Reading |
| Knowledge | Process Standard Job |
| Parts | Process Part |
| Process Part Price | |
| Strategy Task | Process Strategy Task |
| Work Order | Process Work Order Financial Summary |
| Reference | Process Catalogue Profile |
| Process Cost Centre | |
| Process Cost Expense | |
| Process Fleet | |
| Process Labour Activity | |
| Process Labour Rate | |
|
Process Model |
|
| Process Planning Group | |
| Process Work Group | |
| Setinel | Notification |
| Work Order Completion Comments | |
| Work Order Documents | |
| Work Order Labour | |
| Work Order Operation Status | |
| Work Order Status |
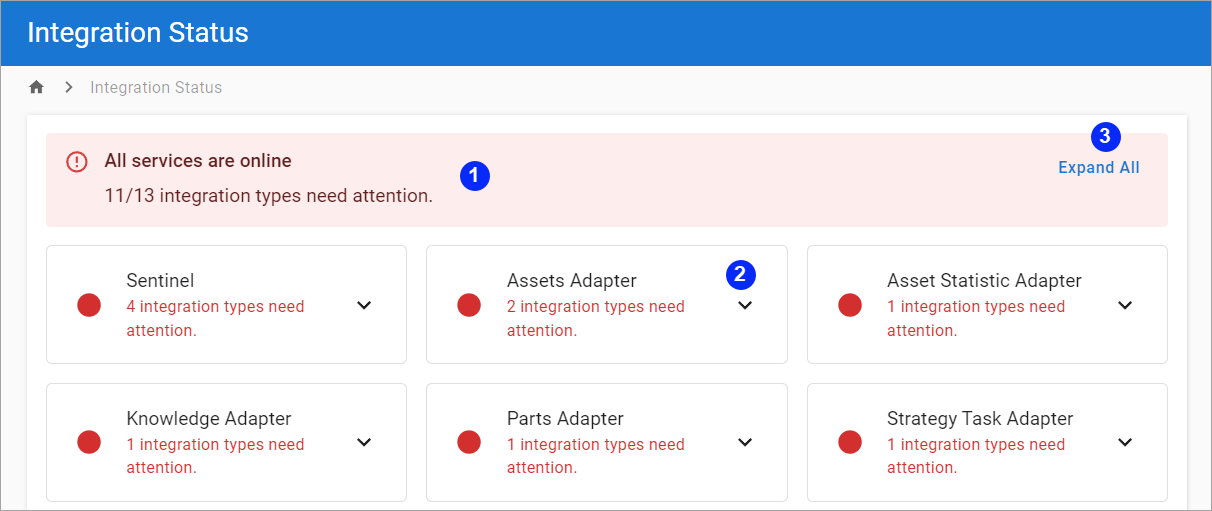
The Integration Status Dashboard gives you an overall view of the integration health by adapter with an indicator if operational or when help is needed.
With the Sentinel process sending integration messages for work order status updates, labour updates, work order completion comments, work order operation status updated and notifications in the background, this application will allow a you to see if there are any errors from these processes and allow them to be addressed.
The app allows allocated users with the appropriate permission to the app to see and manage integration status without relying on technical administration resources to investigate log files. The standard security model applies to the app and is managed using Group Permissions.
If an adapter is offline, it is clearly visible.

In the Dashboard, you can interact with the information displayed.
| Item | Description |
|---|---|
| 1 | Bar indicating the status of services in addition to the number of integration types where the user should investigate the process further. |
| 2 |
Each integration type is grouped by its adapter, and these adapters display as tiles with a red or green indicator. The down arrow displays the integration types associated with the adapter that are healthy or not healthy, and how many errors apply to that integration process. For example, in the screenshot below, the Asset Adapter has two areas that require further investigation - Process Asset, which has five errors and Process Functional Location, which has one error. By comparison, the Reference Adapter Process Fleet is healthy and displays in Green. |
| 3 | Ability to Expand All or Collapse All tiles with one click versus each tile individually. |
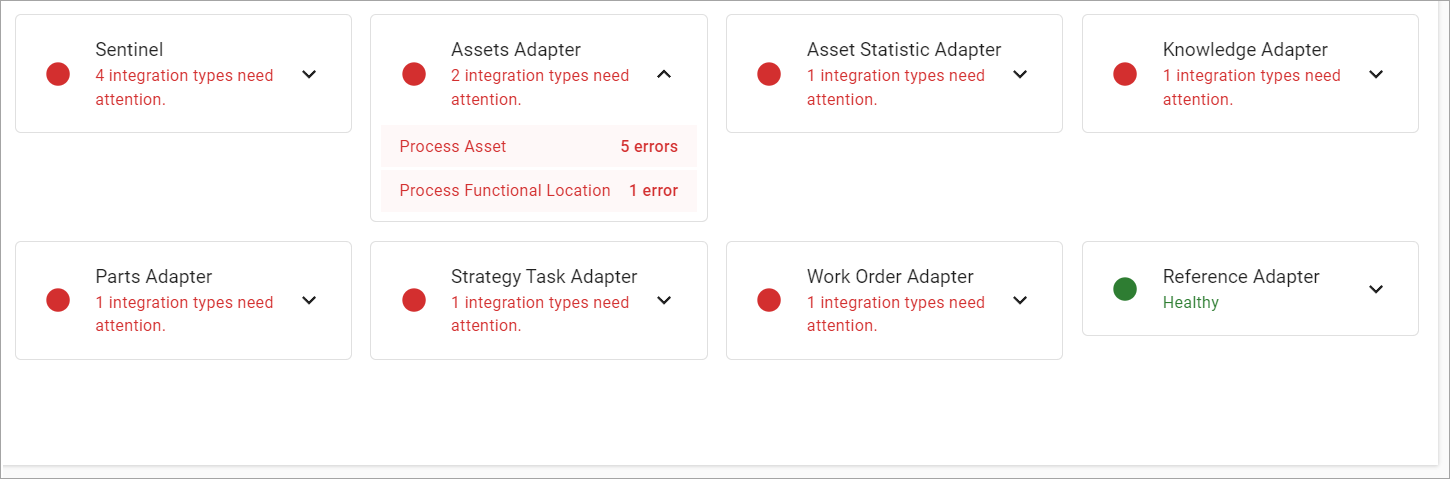
Each integration type can be selected from the Dashboard, and the detail investigated using the Integration Status Request screen. Both successful and unsuccessful processes can be investigated, however, for a successful process you will need to adjust the filters to see the successful transactions as the default 'as delivered' filters focus on items needing investigation.