Chart terminology |

|

|
|
Chart terminology |
|
|
Chart terminology |
|
|
|
Chart terminology |
|
|
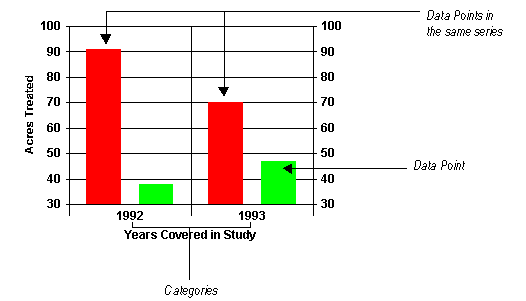
Charts provide a graphical representation of data. Values or data points are displayed in formats such as: bars, lines, markers, filled areas, bubbles, or pie slices. These data points are grouped into series that are identified with unique colors or patterns. In many chart types, one data point from each series is grouped together by category along an axis.