Common axis elements |

|

|
|
Common axis elements |

|

|
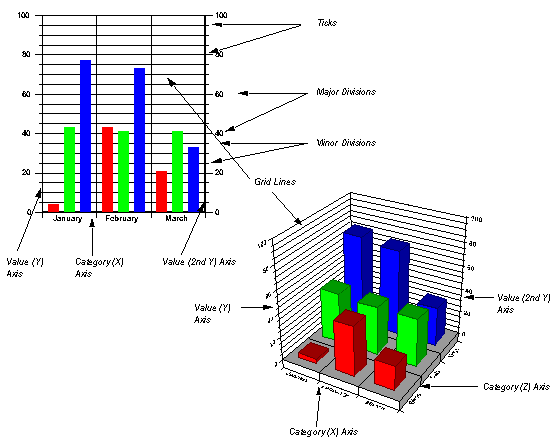
The axes that the charting utility displays on a chart vary from one chart type to another. The following illustration shows the common features of axes on 2D and 3D bar, line, area, and step charts.

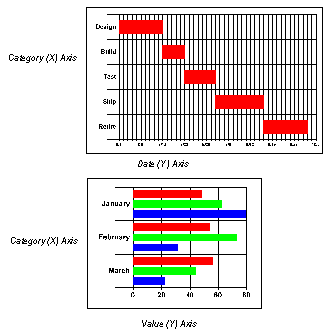
Both Gantt and horizontal bar charts display the category (X) axis vertically along the left side of the chart. Gantt charts display the date (Y) axis along the bottom of the chart. Horizontal bar charts display the value (Y) axis along the bottom of the chart.

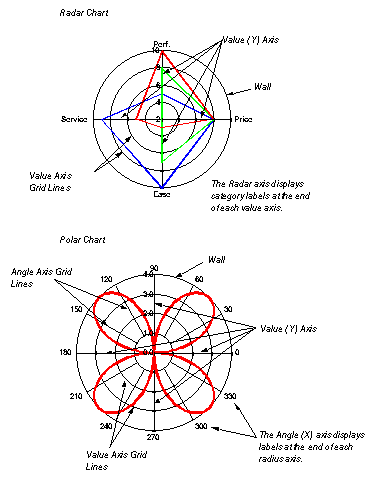
The axis elements on radar and polar charts are slightly different. The following illustration shows the axis elements displayed on these two types.

|
Pie and doughnut charts have no axis information, but use the format settings for X axis labels to format the labels on an individual pie or doughnut chart. |