Stacking series in a chart can provide a better way of plotting similar data for multiple series. By stacking the data, you can illustrate changes and trends for multiple series together in one chart position. Stacking data can eliminate the obstructed views common to 3D charts.
To stack series:
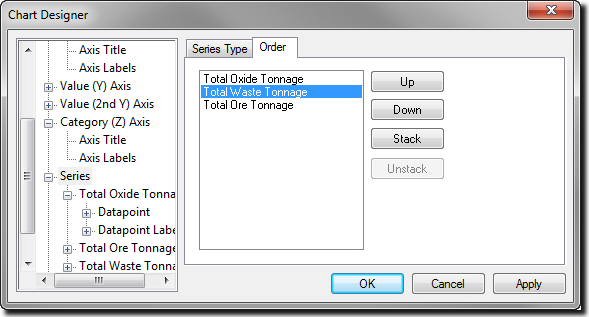
| 4. | Select the second of two series you want to stack in the series order list. For example, if you had the list of series below and wanted to stack and , you would select . You may need to change the order (or follow the unstack tip below) to stack series that are not consecutive in the series order list.
 |
| 5. | Click . In the example above, this would result in XPAC stacking and . |
| 6. | Continue to select series and clicking until you have stacked all the series you want to stack. The order in which the series will display in the stacked list is the order in which they are drawn: first series on the bottom of the stack. |
| 7. | Click to redraw the chart. |
To unstack the series, select the stack associated with the series in the series order list and click .

|
If you want to stack two series that are not one after the other in the series order list, but do not want to change the order of the series, you can stack all of the series between and including your target series and unstack the series you do not want to include.
|
See Reordering Series for more information.


