The Elevation and Contour tabs |

|

|
|
The Elevation and Contour tabs |

|

|
If you have chosen an elevation chart type (2D contour or 3D surface), the Plot menu in the Chart Designer dialog box will include an Elevation tab and a Contour tab. You can use these tabs to format elevation and contouring information for the chart.
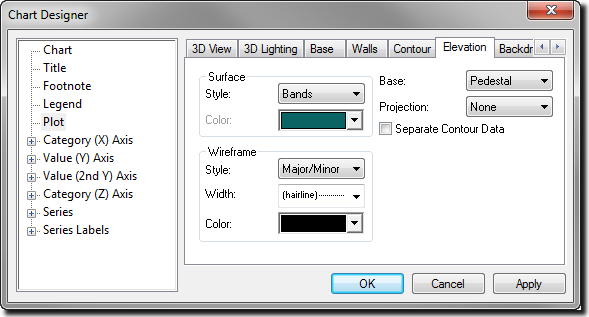
The Elevation tab contains basic contour and surface options.

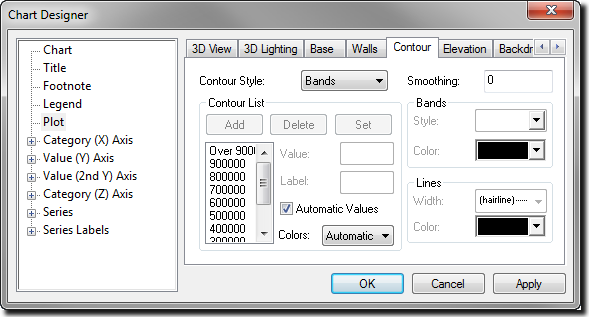
The Contour tab controls the assignment of colours and line widths used in the actual contour bands and lines.

In each tab, the available options depend on the chart type you have specified and will be unavailable if they do not apply to the current chart type.