Viewing dependencies |

|

|
|
Viewing dependencies |

|

|
Dependencies can be viewed in a table or on a graphical plot. Both methods have their advantages and disadvantages. The Schedule Analysis tool also contains a form that allows a user to view how dependencies are being satisfied. This is particularly important when confirming rules has been implemented correctly and is described later in this users guide.
To examine individual dependencies, the Dependencies window should be opened using the Scheduling > Dependencies menu option.
This will open a window with a database tree structure in the left pane. When a record is selected in the tree, its predecessors are listed in the right pane. Clicking the Show Successors check box will display the successors of the selected record after its predecessors. In the window, predecessors are shown in red and successors are shown in blue.
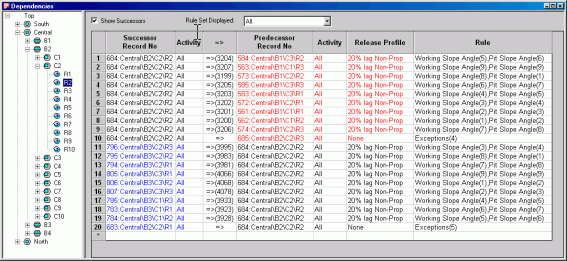
The user is able to filter the dependencies so that only those generated by the selected rule sets are displayed. The default option is All - No Rule Information, which displays every dependency, but does not indicate which rule set created it. The user can also select the option All, which will include the name of the rule set that created the dependency, but this additional information does make the window respond a little slower.
The items in the database tree structure are usually shown in black. But if a circular reference exists in the project, the colour of records within the circular reference will be shown in red. Parents of the records within a circular reference are also shown in red, making it easy to identify where they occur in a project. This requires the Circular Reference Record Colouring checkbox in the Global Options dialogue is ticked.
Dependencies can be viewed graphically on any spatial data plot. To activate this feature, the Dependencies tab in the plot's Properties window should be selected and one of the four dependency rule options selected.
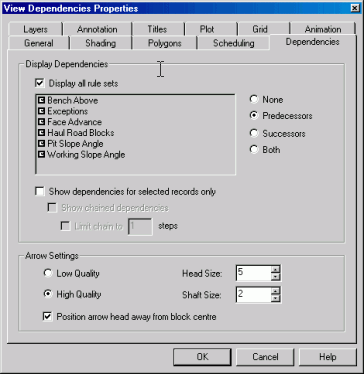
By default, no dependencies will be display on the spatial data plot but the user can choose to display predecessors, successors or both. The later option is only appropriate when chained dependencies are being displayed.
If the user selects the Predecessors option, red arrows will be drawn that point from this block to each of its predecessors. If the user selects the Successors option, blue arrows will be drawn from each of this blocks successors to this block. In both cases the arrow is drawn From the successor To the predecessor, reinforcing the principle that dependencies are always defined by selecting a blocks predecessors and never its successors. If the user selects the Both option, both the red and the blue arrows will be displayed. When both a red and a blue arrow join two records, the colour of the arrow is changed to magenta.
If a dependency has any special properties assigned to it (for example, if it is in an OR rule group or has a release profile) it will be displayed in pink or light blue, depending on whether it is pointing to a predecessor or from a successor.
By default, the Display All Rule Sets checkbox will be ticked. This option displays all dependencies in the current scenario. But if this check box is not selected, the user can select the individual rule sets that must be displayed.
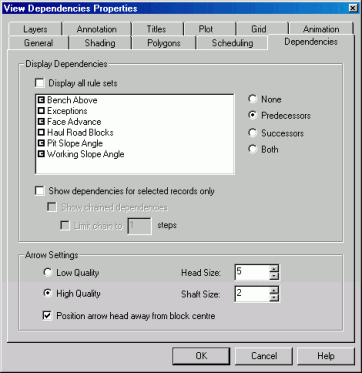
If the user selects only a sub-set of the rules that have been applied to the scenario, different dependencies to those in the scenario may be displayed due to differences in the optimisation process. The inclusion of rules that are not in the current scenario may effect the way some of the other rules are optimised. Because of this, the selection of specific rules is normally used to view the effects of one or two rule sets before adding it to a project.
If the Show Dependencies For Selected Records Only checkbox is ticked, dependencies will only be shown for the records that have been selected. When this option is selected, the user can choose to displaying a chain of dependencies limited to a specified maximum depth.
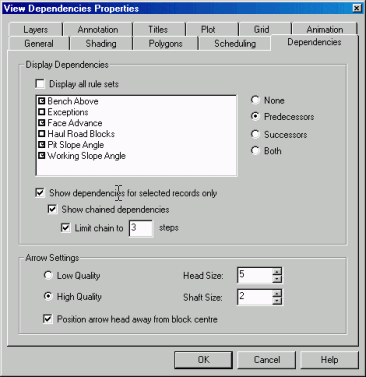
If the Show Dependencies For Selected Records Only checkbox is not ticked, every dependency between records in the plots range will be displayed as an arrow. As there can be thousands of dependencies, this checkbox is normally left ticked.
The user has several options regarding the quality of the arrows used to represent dependencies. High quality arrows are better when plots are rotated in 3D, but they do take longer to render. When high quality arrows are selected, the user can vary the arrows shaft and head size. He can also draw the head of the arrow a small distance before the centroid of the predecessor, to avoid them getting confused with other dependencies that point at the same record.
The following example shows a split graphics window containing an isometric view of an area and a section through it. The red arrows point to the selected blocks predecessors whilst the blue arrows point from its successors to the selected block. The selected blocks are shaded.
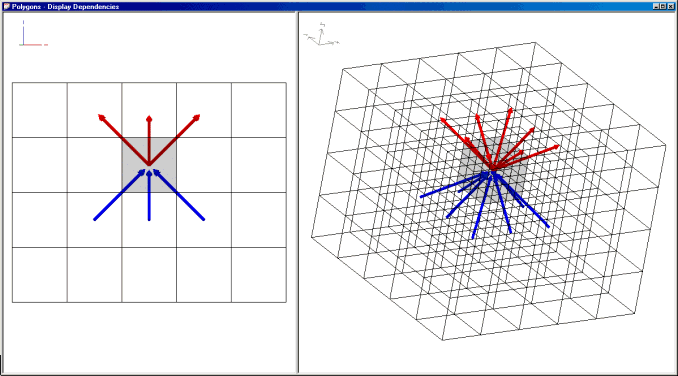
It should be noted that all arrows point to predecessors, regardless of their colour. This reinforces the principle that dependencies are always defined by stating a blocks predecessors and never its successors.