Business graph options |

|

|
|
Business graph options |

|

|
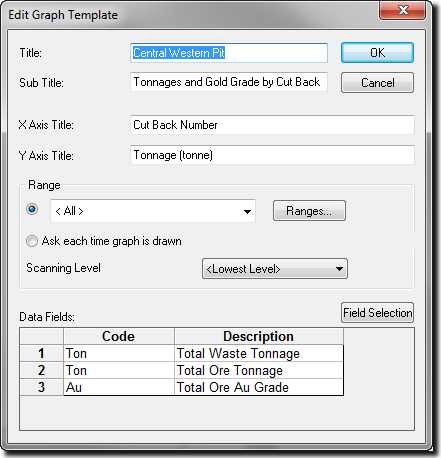
You can display the options for a business graph from the database Reports dialog box. Select the business graph for which you want to view the options and click Edit to display the Edit Graph Template dialog box:

The Title and Sub Title are positioned on the centre top of the business graph.
The X Axis Title is positioned underneath the x axis. This axis will contain the selected database records.
The Y Axis Title is positioned to the left of the y axis. This axis will contain the scale for the selected data fields.
Once the graph is displayed on the screen, the position of any of the titles can be altered by drag and drop. You are also able to change the font, size and colour of the titles.
The database range is used to determine the database records that are displayed on the x axis of the business graph. Select an existing range from the drop down list or click Range to create a new database range.
Below the database range is the Ask each time graph is drawn radio button. If you select this radio button, XPAC will ignore the existing database range and instead ask you to select a database range each time that you generate the business graph.
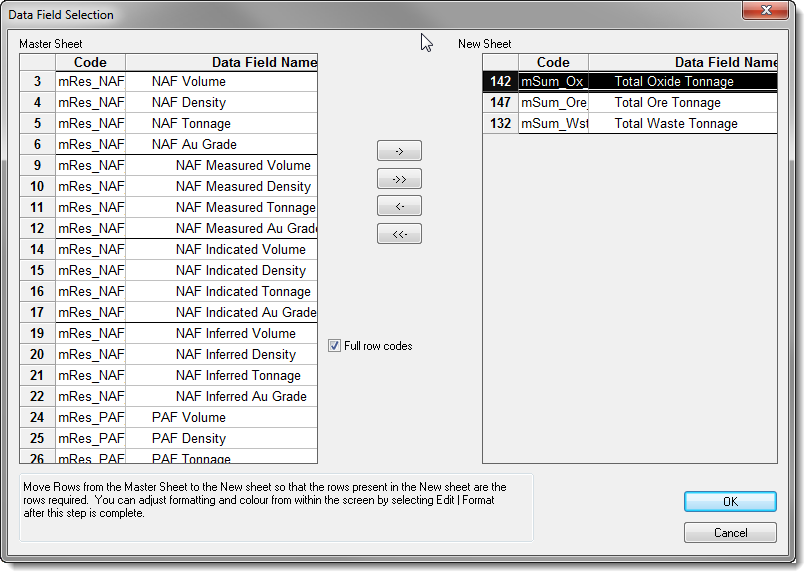
At the bottom of the Edit Graph Template, you can select the data fields you want to graph. Click Field Selection to display the Data Field Selection window.

On the left of this window, XPAC displays all of the non-title data fields from the currently active database (the Master Sheet). On the right of this window are the data fields that you have selected for inclusion in the business graph (the New Sheet). To select data fields, select them in the Master Sheet then click the right arrow to transfer them to the New Sheet. You can insert the data fields above or below your cursor position in the New Sheet.
You can use the left arrow to remove data fields from the New Sheet. The double arrows add (right double arrows) or remove (left double arrows) all data fields.
When you have selected all of the data fields for the business graph, click OK to transfer them to the Edit Graph Template.