Business graphs |

|

|
|
Business graphs |

|

|
Business graphs are a type of database report. You can access the list of business graphs or create a new business graph by selecting View > Database Reports or clicking Database Reports on the toolbar. XPAC will display a list of all database reports, including business graphs in the Reports dialog box.
A business graph is a graphical presentation of the database data. On a business graph you are able to plot the values of specified data fields for selected database records. Fastgraph is a simple form of a business graph where the graph settings cannot be saved.
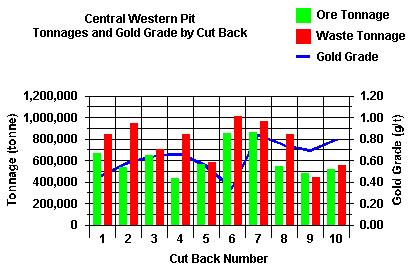
In the example business graph below, we have plotted waste and ore tonnages as a bar graph on one Y axis and gold grade as a line graph on a second Y axis. These parameters have been plotted for each cut back in the deposit.
