Chart elevation options |

|

|
|
Chart elevation options |

|

|
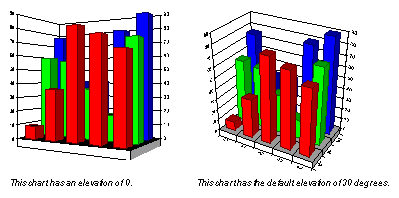
An important aspect of changing the 3D view is altering the elevation at which the chart is viewed. Elevation is defined as the relative height from which a chart is viewed. An Elevation height of 90 positions the chart as if you are looking directly down on the top of the chart. An elevation of 0 positions the chart as if you are looking directly at the side of the chart. The default elevation is 30 degrees. The following illustration shows a 3D chart at two different elevation levels.

You can change the chart elevation in the Chart Designer from the 3D View tab of the Plot menu item.
Related topics |