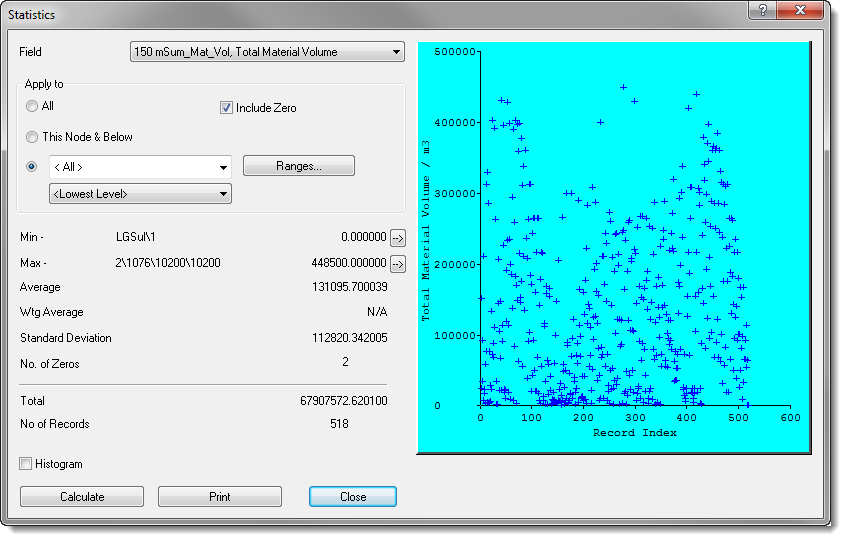
The function lets you display statistical data for a selected data field. This function is available from all XPAC databases (Main, Parameters, Calendar and Results).
| 1. | Select the required cells in the data sheet for the statistics that you want to generate. |
| a. | Right-click and select ; or |
| 3. | Click . (By default, statistics are not displayed.) |
Field Statistics window
There is a range of information displayed on the Field Statistics window and a number of options that can be changed. These are described below.

Field
On the top left of this window, the selected data field is displayed in a drop down box. A new data field can be selected at any time. To display the statistics for a new data field, click on the button.
Apply to
The Field Statistics can be displayed for any selection of database records.
| • | If is selected, then the data field values for all lowest level records will be used in the Field Statistics. |
| • | applies to the record on which your cursor was positioned when you opened up the Field Statistics window. All lowest level records underneath your cursor position will be used in the Field Statistics. |
| • | Range allows you to select a database range from the drop down list. To create a new range click on the button. The level set in the database range is ignored and lowest level records are used. |
Statistics
The following statistics are displayed for the selected data field and database records:
| • | Min - the database record with the minimum value for the data field is reported as well as the data field value. |
| • | Max - the database record with the maximum value for the data field is reported as well as the data field value. |

|
If required, you can navigate to the minimum and maximum values by clicking the right arrows.
|
| • | Average - the average value is the sum of the data field values for all selected records, divided by the number of records. |
| • | Wt Average - the weight average is only calculated for weight average data fields. Other data field types will be marked as N/A. |
| • | Standard Deviation - the standard deviation of the values for the selected records is displayed in this field. |
| • | Number of Zeros - the number of lowest level records that have a zero value is displayed here. |
| • | Total - the data field values for the selected records are summed to give the total. This field will be meaningless for non-additive fields. |
| • | Number of Records - the number of lowest level records used in the field statistics is displayed here. |
Calculate
The button should be used each time you enter the Field Statistics window or if you change the data field or the "Apply to" options.
Graph
On the right half of the Field Statistics window, the data field values for the selected records are displayed as a scatter plot. The values can also be displayed as a histogram by ticking the box at the bottom of the window.
Print
The Field Statistics window can be printed by clicking on the button. The selected data field, the graph and the statistics are presented on a standard format printout.


