Histogram report |

|

|
|
Histogram report |

|

|
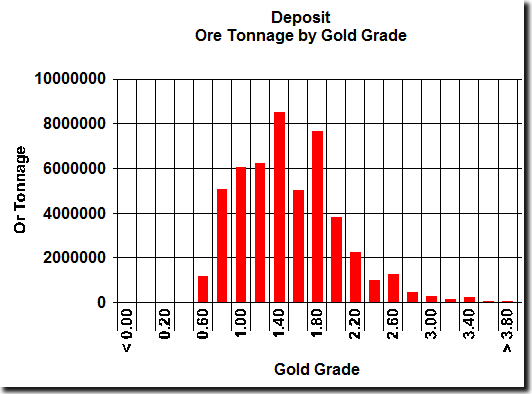
A histogram report generates a graph showing how data field values vary with respect to one another. A selected range of records are grouped according to the value of one of their data fields (called the Interval Field) and the total value of another data field (called the Frequency Field) is reported and graphed for each grouping.
In the example histogram report below, ore tonnages have been divided into increments of gold grade. The Total Ore Au Grade is the Interval Field and the Total Ore Tonnage is the Frequency Field. Such a graph is useful for determining the ore reserves that are available above some quality cut-off.
