Histogram report options |

|

|
|
Histogram report options |

|

|
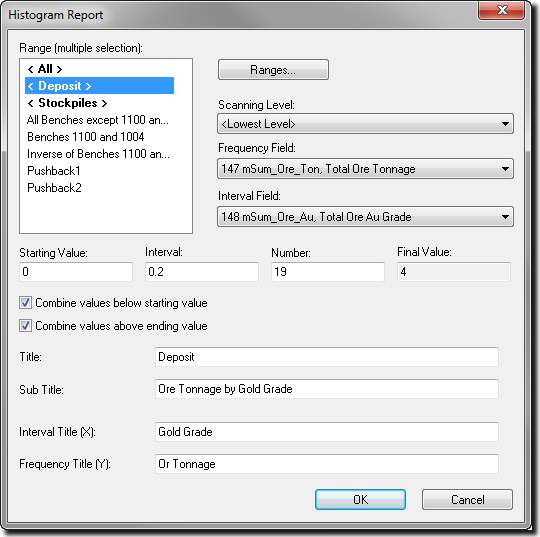
A completed Histogram Report dialog box might look as follows:

The database range is used to control the lowest level records that are included in the accumulations for the Histogram Report.
The database range is selected from the drop down list. It is not possible to create a new database range from inside the Histogram Report template. To do this you must return to the database window.
The Frequency Field is selected from all non-title fields in the active database. This is the field that is accumulated into groups (Intervals) according to the value in the Interval Field for the same record.
If the Frequency Field is an additive field, then the values are simply summed in the Cross Tab Report. If the Frequency Field is a weight average, then the values are weighted using the weighting field assigned in the database. If the Frequency Field is an average field, then the values are arithmetically averaged.
The Interval Field is selected from all non-title fields in the active database. The value of the Interval Field is used to group each record in the database range into a particular Interval.
The Starting Value, Interval and Number are used to define the X axis on the Histogram Report. The Starting Value is the left most value displayed on the X axis. The Interval represents the graduation marks on the axis. The Number times the Interval plus the Starting Value gives the Final Value or right most value on the X axis.
The Frequency Field is accumulated for each Interval that is displayed on the Histogram Report.
If you want to combine values beyond the boundaries of the report, select the appropriate check box. XPAC combines values outside the report at the lower or upper level of the X-axis, as selected.
The Title and Sub-Title are displayed on the top centre of the Histogram Report.
The X Axis Title is displayed underneath the X Axis or the Increment Field values.
The Y Axis Title is displayed to the left of the Y Axis or the Frequency Field values.