Selecting a chart type |

|

|
|
Selecting a chart type |

|

|
In the Chart Designer dialog box, you can control the chart type on the Type tab of the Chart menu. Depending on the chart type you select, you may also be able to choose to stack or unstack the chart on the Order tab of the Series menu.
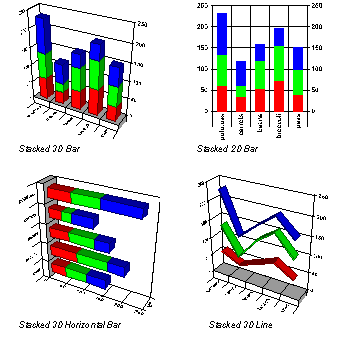
You can stack series in a bar, line, area, step, combination, clustered bar, and horizontal bar chart. Stacking places the data points from the same category on top of each other. Each bar still represents the same value.
Stacking data shows how all categories in a series compare over time, or compares each part to the total. The following illustration shows the stacked variations of several chart types.
