Stacking on a percent axis |

|

|
|
Stacking on a percent axis |

|

|
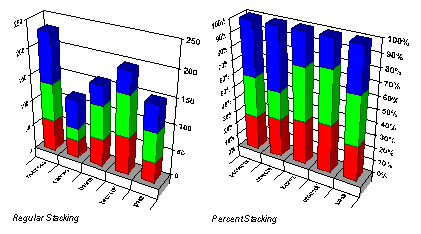
When series data is stacked on a percent axis, all the values in each category are added together. That sum is considered 100 percent. Each data point in the category is drawn as a percentage of that sum. You can stack series on the Order tab of the Series menu and the set the Y-axis scale to a percent on the Scale Type tab of the Value Axis menu.
The following illustration shows the same chart with regular stacking and stacking on a percent axis.

|
To display other types of percent stacking, change the scale of the charts Y axis. |