Setting series options |

|

|
|
Setting series options |

|

|
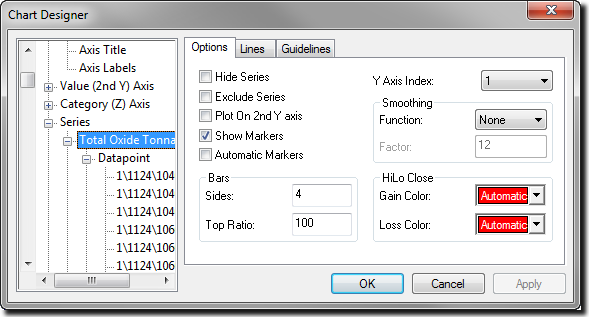
The Options tab for each series hide or exclude a series, plot the series on a secondary Y axis, change style of bars on a bar chart, set the gain and loss colours used in a hi-lo chart, and control smoothing for line and area series types.

If you choose to hide a series, the space occupied by the series is still shown on the chart, but the data is not displayed. If you choose to exclude a series from a chart, the data is not displayed and the space occupied by the series is removed from the chart.
The following illustration shows the difference between hiding and excluding a series.

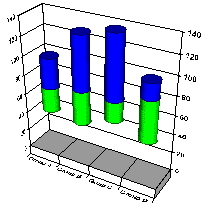
The following illustration shows how hiding a series in a stacked chart can produce floating chart elements.

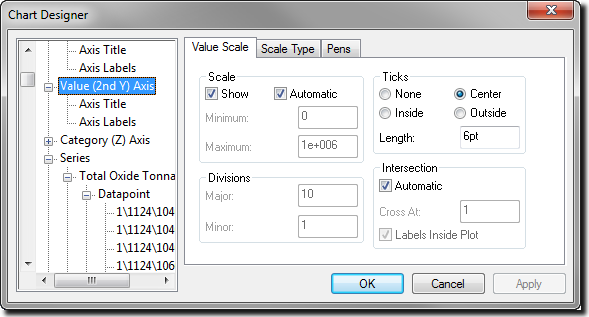
You can also use this tab if you want to plot the current series on the secondary Y axis instead of the primary axis. You may then want to change the scale, type, or format of the secondary axis to best display the series data. To do this, you need to access the Value (2nd Y) Axis Chart Designer dialog box menu option.
