Bar shapes |

|

|
|
Bar shapes |

|

|
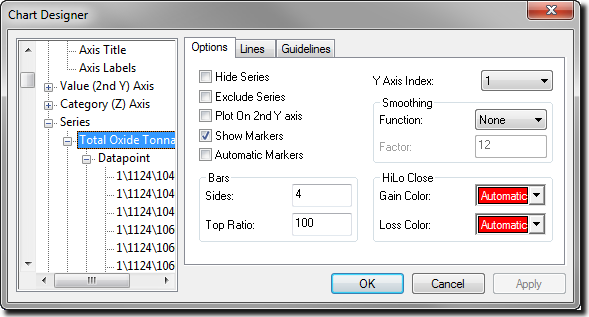
You can control the appearance of bars in 3D bar charts; including horizontal bar charts, Gantt charts, and clustered bar charts on the Options tab of the appropriate series menu item.

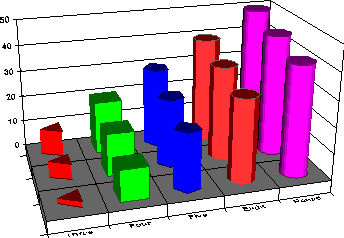
You can specify the number of sides for bars by entering a value between 1 and 360 to indicate the number of sides for the bars. If you enter 1, First Impression determines how many sides are necessary to create a round column, given the size of the bar. The following illustration shows a number of different bar styles that can be created by changing the number of sides.

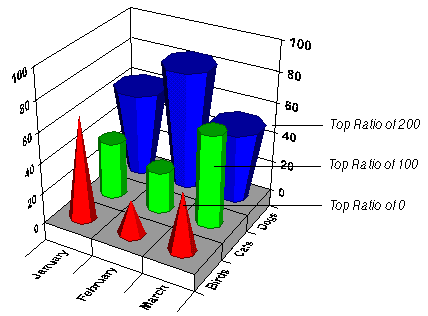
Top Ratio is defined as the percentage of the bottom diameter of a bar used to draw the top of the bar on a chart. Valid numbers are between 0 and 10,000 to indicate the percent of the bottom diameter. Values less than 100 result in a top smaller than the bottom. Values greater than 100 result in the top wider than the bottom. The following illustration shows the effects of changing the top ratio on several bars.
