Status bar |

|

|
|
Status bar |

|

|
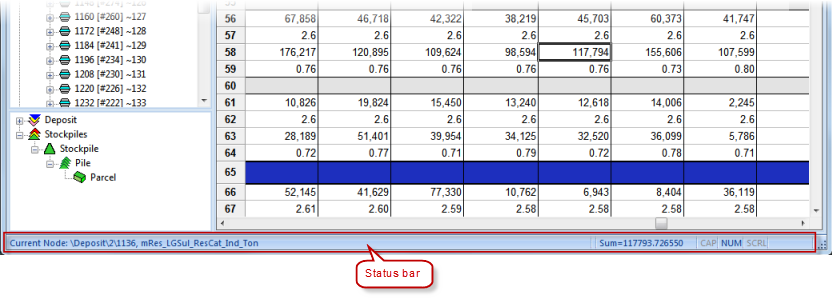
XPAC displays a status bar across the lower edge of the main workspace:

The status bar displays system information, for example, if you hover over a menu item or button on the toolbar, a more detailed description displays. Similarly, if you are viewing a database, the status bar displays the value of the selected cells (for example, an average value).
Depending on the position of your cursor, XPAC displays system information (for example, For Help, press F1) or cell information (for example, the currently selected database record) on the far left of the status bar:

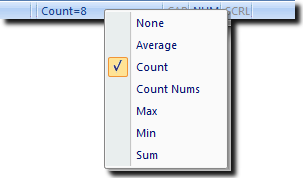
When viewing a database data sheet, XPAC displays cell or cursor values (depending on the function that you are currently using) towards the right of the status bar. You can change the detail of the information that displays by right-clicking the aggregate function and selecting the value type that you want to use:

The table below describes the value types that you can select for the aggregation function in the status bar:
Unit |
Description |
|---|---|
None |
Displays nothing in the section of the status bar reserved for the aggregation function. |
Average |
Displays the average of the selected cells. |
Count |
Displays the number of cells that are currently selected, including empty cells (for example, section headers). |
Count Nums |
Displays the number of cells that are currently selected that contain data, excluding empty cells (for example, section headers). |
Max |
Displays the largest value out of the selected cells. |
Min |
Displays the smallest value out of the selected cells. |
Sum |
Displays the total value of all the selected cells. |
When viewing a spatial data plot in top view, the status bar displays the coordinates of your cursor:
