Main workspace |

|

|
|
Main workspace |

|

|
The main workspace is the key component of the XPAC window; it displays main functions such as database data sheets, scheduling data, reports and spatial data plots. Each time you open a function, XPAC displays a corresponding tab that you can move or resize as required. You can also display the event log in the main workspace.
Use the event log to help you locate errors in your schedule.
To run the event log:
| 1. | Select View > Event Log. The Event Log pane displays. |
| 2. | Select the events that you want to include in the event log: |
| a. | Right-click anywhere in the Event Log window and select Filter. The Event Filter window displays. |
| b. | Select the check box of each Event Type that you want to record. |
|
Select the Debug check box if you want to capture any debug results. |
| c. | Click OK. |
XPAC runs the event log in the background to let you capture any errors while running a schedule.
If you are running the event log, you may want to change the way it displays in the main workspace, for example, you may want to hide, dock or move it to another location.
You can anchor the event log pane to the main workspace by docking it.
To dock the event log pane:
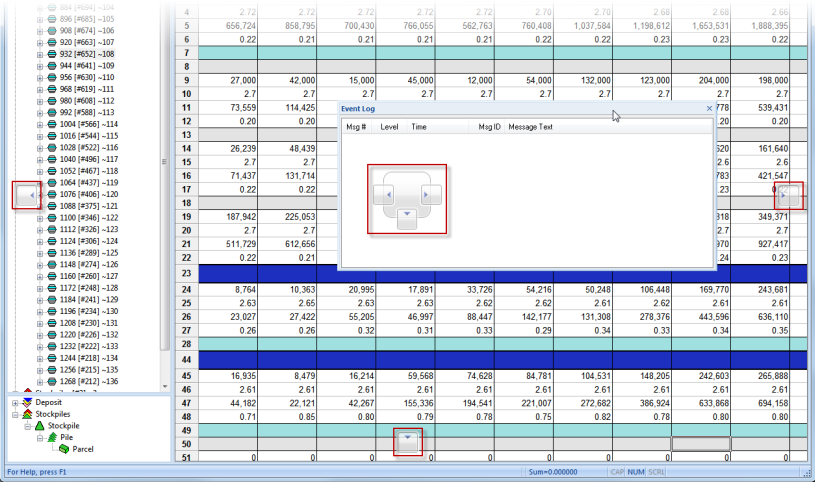
| 1. | Click and hold the title bar of the event log. The guide diamond displays, helping you to dock the pane: |

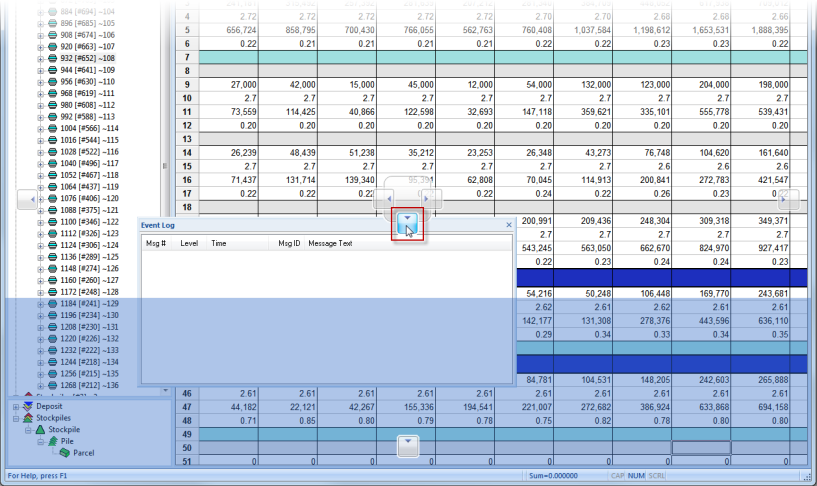
| 2. | Move the cursor over the guide diamond to where you want to dock the event log. XPAC highlights the new location of the event log: |

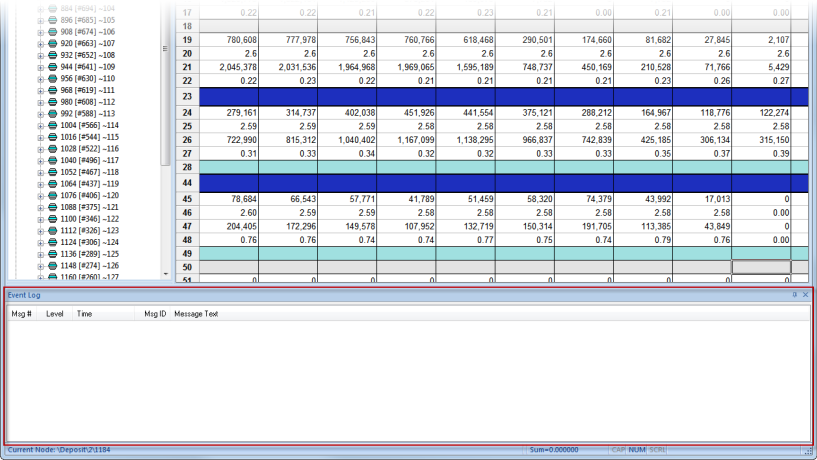
| 3. | Drop the event log pane onto the guide diamond. The pane docks to the area that you specified: |

|
To undock the event log, drag the title bar of the pane away from the docked position. |
If you want to save space in the main workspace area, you can hide docked panes so that they slide out of view when not in use.
To hide the event log pane:
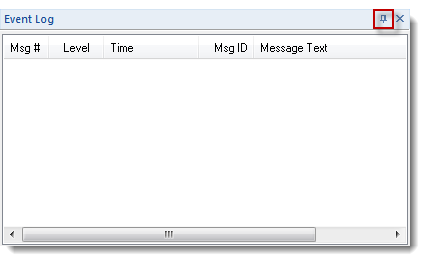
| 1. | Click Auto-Hide on the title bar: |

| 2. | The view displays as a tab against the side to which you docked the pane: |

| 3. | To access the event log, click or hover over the tab. The event log slides back into view for a few seconds. |
|
To return to the docked view, click Auto-Hide again. |