The chart data grid |

|

|
|
The chart data grid |

|

|
Each chart is associated with a data grid. This data grid is a table that holds the data being charted. The data grid can also include labels used to identify series and categories on the chart. The person who designs your chart application fills the data grid with information by inserting data, or by importing data from a spreadsheet or array.
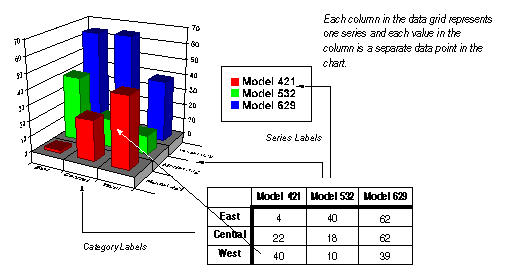
The following illustration shows the relationship between a data grid and a chart.

In most cases, each column in the data grid translates to one series on the chart. However, the graphing utility supports a number of chart types that require two or more columns of data to chart a series. These chart types include XY, polar, bubble, hi-lo, and Gantt charts.