Using the Legend Wizard to set up shading |

|

|
|
Using the Legend Wizard to set up shading |

|

|
Use the Legend Wizard to help you set up a legend for your spatial data plot.
| 1. | Click Legend Wizard on the Shading tab of the plot's Properties window. The Spatial Data Legend Wizard window displays. |
| 2. | Navigate through the pages by clicking Next and/or Back. |
When you have set up the legend using the wizard, it displays in the Shading tab of the plot's Properties window.
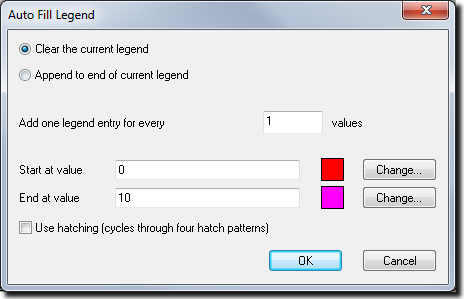
The Legend Wizard also helps you automatically create the increments and colours for your legend by using Auto Fill Legend:

Option |
Description |
||
|---|---|---|---|
Clear the current legend |
Replaces the current legend with the new legend that you are creating. |
||
Append to end of current legend |
Adds the new legend to the current legend. |
||
Add one legend entry for every <x> values |
Controls the size of each increment in the legend.
|
||
Start at value |
Specifies the lowest value in the legend / plot.
|
||
End at value |
Specifies the highest value in the legend / plot.
|
||
Use hatching (cycles through four hatch patterns) |
Determines whether XPAC uses a series of hatch patterns in addition to the start and end colours. |
* XPAC automatically assigns each increment in the legend a colour based on the start and end colours that you define, for example:
Start colour |
End colour |
Legend |
|---|---|---|
|
|
|
|
|
|