Smoothing series data |

|

|
|
Smoothing series data |

|

|
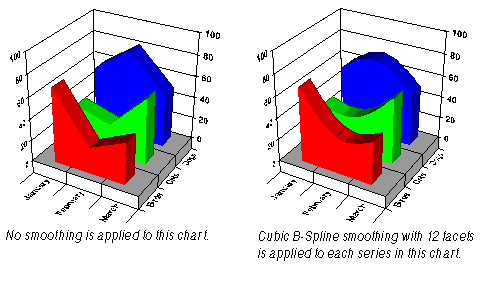
Smoothing is the process of using one of several mathematical formulas to divide the chart data into a number of facets. When the chart is drawn using these facets, the result is a smoother curve to the series lines.
You can smooth line and area series chart types. The following illustration shows the results of smoothing the series in a 3D area chart.

You can control series smoothing by from the Options tab (see Setting series options). The following table describes the smoothing formulas that can be used to smooth series data.
Smoothing Type |
Description |
|---|---|
None |
No smoothing is applied to the data. |
QuadraticBSpline |
A quadratic B-spline formula determines the smoothing applied to the data. This form of smoothing results in a less-smooth curve that stays closer to the data points. |
CubicBSpline |
A cubic B-spline formula determines the smoothing applied to the data. This form of smoothing results in a smoother curve, but varies further from the data point than a QuadraticB spline curve. |
In order to smooth series data, you must specify the series smoothing factor. The factor is the number of facets or points sampled between the chart data points to create the smoothing effect. The higher the number, the more smoothing occurs.