Changing the series fill and pen |

|

|
|
Changing the series fill and pen |

|

|
Open the Chart Designer dialog box to change the series fill or pen.
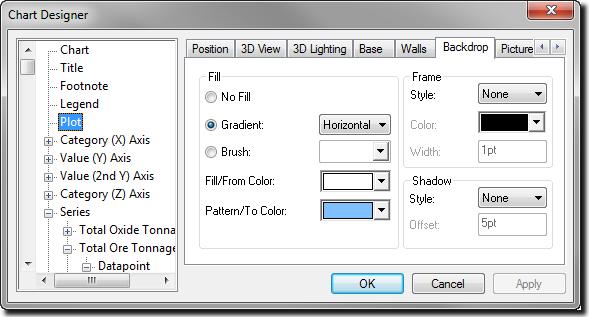
All series: You can change the fill colour for all series on the Backdrop tab available from the Plot menu.

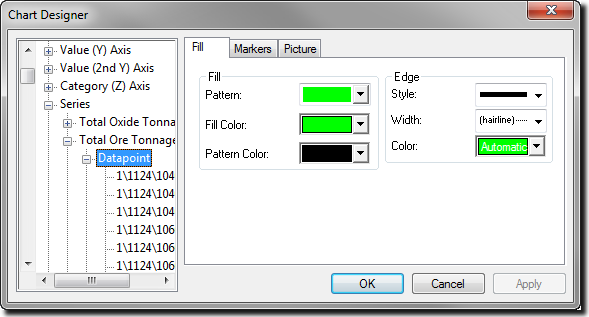
One series: You can change the fill colour for each series on the Fill tab of the Datapoint menu. The Datapoint menu is the third level menu under Series.

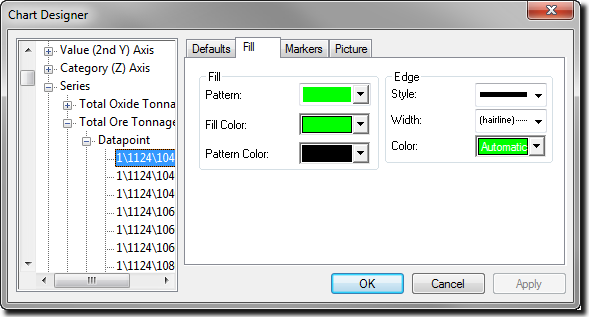
One datapoint: You can also change the fill for each individual datapoint from that datapoint's menu.

Patterns are bitmaps. A low resolution version of each bitmap is used to display the pattern on the screen. When you print a chart, a high resolution version of the bitmap is used if the output device prints at more than 144 dpi. The higher the resolution of the output device, the smaller the copies of the bitmaps that make up the patterns are reproduced. At high resolutions, the charting utility adjusts the patterns to prevent the lines from getting too close together.
Hatches are not bitmaps, but actual lines drawn to fill the object. They are always drawn at the same resolution, regardless of the output device.
Control the pens used to define the axis and grid lines from the appropriate axis menu of the Chart Designer dialog box. Each axis menu displays a Pens tab at the top level.
