Picture bars |

|

|
|
Picture bars |

|

|
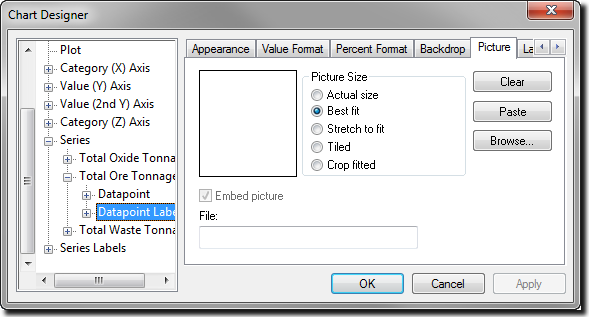
You can specify a graphic image to use as the fill for a series of 2D vertical or horizontal bars or Gantt charts from the Datapoint Labels menu item in the Chart Designer dialog box. Use the settings on the Picture tab:

You can also set a picture for each data point. To do so, move one menu level down and select the data point you want to represent with a picture.