Chart element areas |

|

|
|
Chart element areas |

|

|
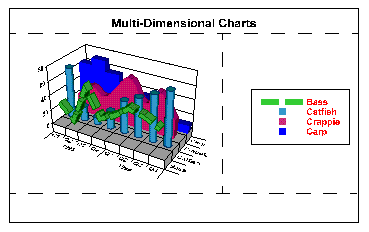
The chart plot, title, legend, and footnote are all drawn within their individual areas of the chart. The size of text used for the title, legend, footnote, and the axis labels and titles determines the size of each area. If you use very large fonts or long text, elements may be cropped and the axis labels and titles may be dropped from the plot. The following illustration shows the chart, title and legend elements in default positions and shows an example of how the chart area is divided for each element.
