Cross tab report options |

|

|
|
Cross tab report options |

|

|
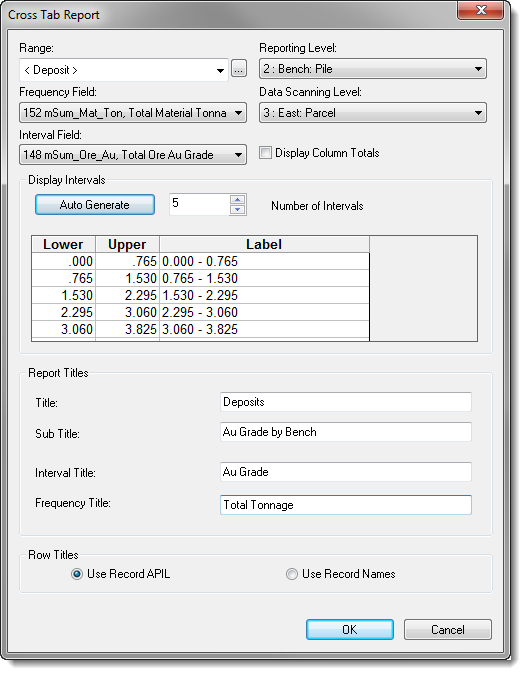
The Cross Tab Report options are shown in the following window:

Use the Range field to control the lowest level records that are included in the cross tab report. The levels set in the database range are ignored for this report (this is also the case in some other areas of XPAC). If a lowest level record falls within the database range, then it will be included in the cross tab report calculations.
The database range is selected from the drop down list. It is not possible to create a new database range from within the Cross Tab Report dialog box. To do this you must return to the database window.
Where the Range field controls the data to include, the Reporting Level field controls how that data is broken up.
The Reporting Level is used in a slightly different way to how it is used in most other areas of XPAC.
For example, if Strip level is selected, then all records in the range are summed up to Strip level. In addition all strips in position in level (pil) number one are summed together and similarly for those in pil 2, pil 3, etc. This summing by pil is where the level is treated differently.
If you do not want the records to be summed by their pil numbers in this way, then you will have to set up a number of database ranges, for each branch of the database structure, and generate a separate cross tab report for each branch.
Use the Data Scanning Level field to control the level at which XPAC will query the database. This will not change the Ranges of data included, or the Reporting Level at which the data is reported.
Select the Frequency Field from the non-title fields in the active database. This is the field that is accumulated into groups (Display Intervals) according to the value in the Interval Field for the same record.
If the Frequency Field is an additive field, the values are summed in the cross tab report. If the Frequency Field is a weight average, the values are weighted using the weighting field assigned in the database. If the Frequency Field is an average field, the values are arithmetically averaged.
Select the Interval Field from the non-title fields in the active database. XPAC uses the value of the Interval Field to group each record in the database range into a particular Display Interval.
The Display Intervals are the groupings required for the Interval Field. For example, if the Interval Field measures gold grade in grams per tonne, the Display Intervals may be as follows:
< 0.4 g/t
0.4 to 0.6 g/t
0.6 to 0.8 g/t
0.8 to 1.0 g/t
>= 1.0 g/t
The lower and upper numeric values for each interval should be entered in the relevant columns. Type the text describing the Display Interval in the Label column. These labels will be the titles used for each row in the cross tab report.
You can type Display Intervals manually in the grid or generate them automatically from the database. To generate fields automatically, select the Number of Intervals you want, then click Auto Generate. You can make changes to auto-generated fields after generating them.
XPAC displays the Title and Sub-Title at the top centre of the cross tab report.
Underneath these two titles, the Interval Title and Frequency Title are displayed as follows:
<Frequency Title>
vs
<Interval Title>