Formatting lines |

|

|
|
Formatting lines |

|

|
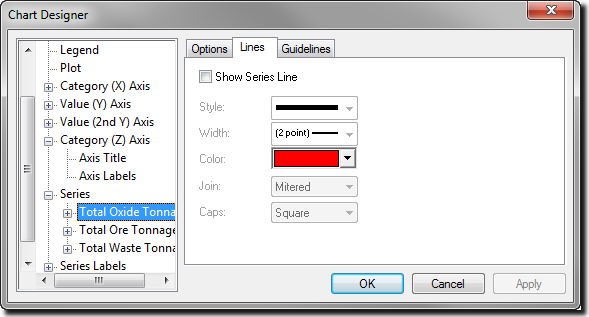
The controls on the Line tab format the style, width, colour, joint, and end caps of 2D lines and the lines in XY, radar, polar, and hi-lo charts. There is a separate Lines tab for each series in the Chart Designer dialog box.

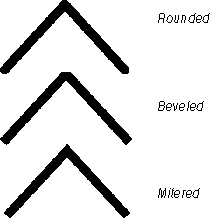
Join styles determine how the lines on your chart will look at the point where they join or meet. Join styles are particularly important when using thick lines on your chart. The following table lists the valid line join styles.
Join Types |
Description |
|---|---|
Mitered |
The outer edges of the two lines are extended until they meet. |
Round |
A circular arc is drawn around the point where the two lines meet. |
Beveled |
The notch between the ends of two joining lines is filled. |
Important Very acute mitered joins are automatically beveled to avoid drawing large spikes along the line.
The following illustration shows an example of each join style.

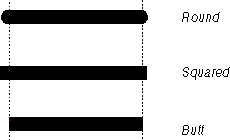
Cap styles determine how the end of each line on your chart is capped. Line caps can enhance the appearance of your chart, particularly if you are using large or thick lines to plot data.
The following table lists valid line cap styles:
Cap Type |
Description |
|---|---|
Butt |
The line is squared off at the endpoint. |
Round |
A semicircle with a diameter of the line thickness is drawn at the end of the line. |
Squared |
The line continues beyond the endpoint for a distance equal to half the line thickness and is squared off. |
The following illustration shows an example of each cap style.
