Surface chart projection |

|

|
|
Surface chart projection |

|

|
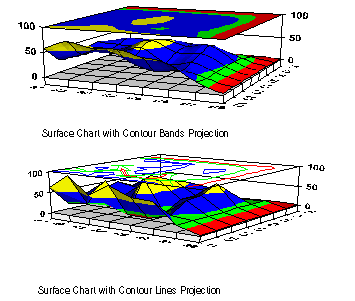
Projection is a charting technique that displays a planar contour chart projected above a surface chart. You can make changes to the projection type on the Elevation tab. The following table defines the three available projection options:
Method |
Description |
|---|---|
None |
No projection is displayed above the chart. |
Bands |
The planar chart reflects the charts contours in contour bands. |
Lines |
The planar chart reflects the charts contours in contour lines. |
This illustration demonstrates the two projection methods which display the contours of the surface chart below.
