Displaying chart surfaces |

|

|
|
Displaying chart surfaces |

|

|
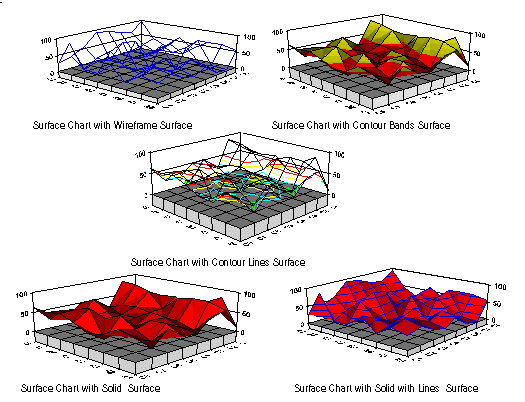
You can make changes to the surface of an elevation chart on the Elevation tab. There are five ways to represent the surface on a 3D surface chart:
Type |
Description |
|---|---|
None |
The surface data is represented exclusively by a wireframe. |
Bands |
The surface displays changes in data with contour bands. |
Lines |
The surface is represented by a wireframe and displays changes in data with contour lines. |
Solid |
The surface is drawn with a solid colour. |
Solid with Lines |
The surface is drawn with a solid colour. Changes in data are indicated by contour lines super imposed on the solid colour. |
The following illustration demonstrates chart surfaces.
