3D Graphics Settings window |

|

|
|
3D Graphics Settings window |
|
|
3D Graphics Settings window |
|
|
|
3D Graphics Settings window |
|
|
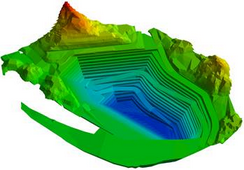
You can define the settings that XPAC uses to generate spatial data plots, for example, the driver that XPAC uses to display plots, or the background colour that the 3D Scene uses.
|
The settings that you specify are saved in the registry for the current user; they are not project-specific. |
To change 3D Graphics settings:
| 1. | Select Tools > 3D Graphics Settings. The 3D Graphics Settings window displays. |
| 2. | Change 3D graphics options as required, for example, change the direction of the plot lighting. |
| 3. | Click OK. |
Setting |
Description |
Options |
||||||||
|---|---|---|---|---|---|---|---|---|---|---|
Driver |
Specifies the driver that you want XPAC to use when generating plots. |
|
||||||||
Background Colour |
Specifies the colour of the background for the 3D Scene. |
|
||||||||
Specifies the type of indicator that you want XPAC to use when you select blocks in a plot. |
|
|||||||||
Display diagnostics in the 3D scene |
Determines whether diagnostics information displays in the top-left corner of the 3D Scene. Provides basic information, for example, the number of triangles, the centre of rotation, distance to target, etc. |
N/A |
||||||||
Determines whether a single light source is used in the 3D Scene. Select the check box to enable the drop-down list. By default, this option is deselected. |
|
|||||||||
Projection Type |
Specifies the projection type that the 3D Scene uses. |
|
||||||||
Object Outlines |
Determines whether the outlines of each block display. |
Note: The lines that display depend on the whether you are displaying 2D or 3D data. For example, only the outline of the polygon displays for 2D data, while XPAC finds the edges where there is a significant change in the orientation of the triangles for 3D.
|
If required, you can access additional driver options by clicking Browse next to the Driver drop-down list. The Select Graphics Library window displays available drivers.