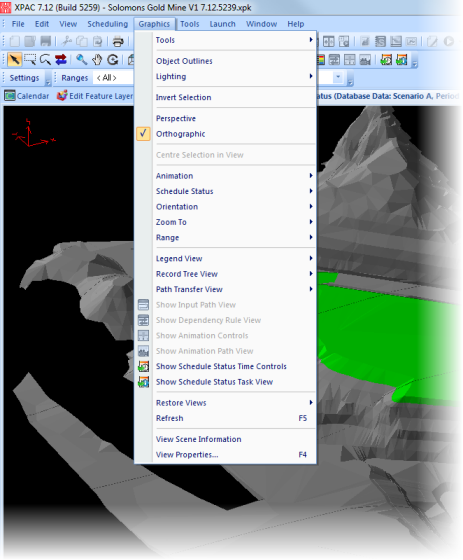
Spatial data plots graphics menu |

|

|
|
Spatial data plots graphics menu |

|

|
You can define the graphics settings that XPAC uses to display spatial data plots, for example, whether plots display using a single light source, defining the perspective type, or displaying block outlines. To access these settings, select Graphics, then select one of the following options:

The table below describes the options available from the Graphics menu:
Menu option |
Description |
Options |
||||||||||||||||||||
|---|---|---|---|---|---|---|---|---|---|---|---|---|---|---|---|---|---|---|---|---|---|---|
Tools |
Lets you access the most commonly used tools available on the 3D Graphics toolbar. |
|
||||||||||||||||||||
Determines whether the outlines of each block display. |
Note: The lines that display depend on the whether you are displaying 2D or 3D data. For example, only the outline of the polygon displays for 2D data, while XPAC finds the edges where there is a significant change in the orientation of the triangles for 3D.
|
|||||||||||||||||||||
Lighting |
Indicates the light source used to illuminate the plot, for example, North. |
Cardinal directions, for example, North, East, South, West, etc. |
||||||||||||||||||||
Invert Selection |
Inverts the current selection of blocks. |
N/A |
||||||||||||||||||||
Objects that are further away from the view point appear smaller in size. |
N/A |
|||||||||||||||||||||
Objects of a similar size appear the same size regardless of distance from the view point. |
N/A |
|||||||||||||||||||||
Centre Selection in View |
Centres selected blocks in the 3D Scene. |
N/A |
||||||||||||||||||||
Animation |
Controls the animation of the plot in the 3D Scene. |
See Animation Controls for more information. |
||||||||||||||||||||
Orientation |
Controls the orientation of the plot in the 3D Scene. |
|
||||||||||||||||||||
Zoom To |
|
|
||||||||||||||||||||
Range |
Select and edit ranges according to the blocks that you currently have selected. |
|
||||||||||||||||||||
Legend |
Displays the Legend View options. |
|
||||||||||||||||||||
Tree View |
Displays the Record Tree View options. |
|
||||||||||||||||||||
Transfer View |
Displays the Path Transfer View options. |
|
||||||||||||||||||||
Show Path View |
Toggles to display or hide the Path View. |
N/A |
||||||||||||||||||||
Show Dependencies View |
Toggles to display or hide the Dependency Rule View. |
N/A |
||||||||||||||||||||
Show Animation Path View |
Toggles to display or hide the Animation Path View. |
N/A |
||||||||||||||||||||
Restore Views |
Lets you arrange the views that are currently displaying. |
|
||||||||||||||||||||
Refresh |
Refreshes the 3D Scene to update the plot that you are currently viewing (for example, if you have updated the settings for the plot). |
N/A |
||||||||||||||||||||
View Scene Information |
Displays XPAC graphics information, for example, information about the plot that you are viewing, or which graphics driver XPAC is currently using to generate the plot. |
N/A |
||||||||||||||||||||
View Properties |
Displays the plot's Properties window. |
N/A |