Axis tick marks |

|

|
|
Axis tick marks |

|

|
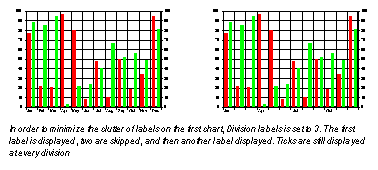
Axis labels contain tick marks that signify the divisions along a chart axis. These labels can occur at major and minor divisions on a chart. Depending on the chart size, labelling tick marks at every division can sometimes result in a cluttered, hard-to-read chart. Skipping labels and tick marks can help reduce the clutter of labels that can occur when you have a large number of divisions.
The following illustration demonstrates the use of this option.

You can alter the scale for an axis in the Chart Designer dialog box on the Scale tab of the appropriate axis menu item.
You can modify the tick marks that the charting utility displays on your chart axes. The length of major tick marks can be modified to best fit the chart. Tick mark position on the axis can also be modified. The following table lists the available tick position settings.
Style |
Description |
|---|---|
None |
No tick marks are displayed on the axis. |
Center |
Tick marks are centred across the axis. |
Inside |
Tick marks are displayed inside the axis. |
Outside |
Tick marks are displayed outside the axis. |