Labeling axes inside the plot |

|

|
|
Labeling axes inside the plot |

|

|
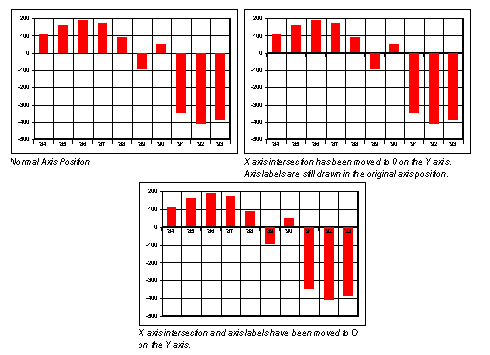
If a chart moves the axis intersection to a point well within the chart plot, it may be difficult to read the labels from their location along the original axis. The graphing utility provides you the option of labelling the axis at its new location to improve label readability.
The following illustration shows axis labelling on the original axis and inside the plot.

You can alter the location of axis labels in the Chart Designer dialog box on the Scale tab of the appropriate axis menu item.