Chart projection |

|

|
|
Chart projection |

|

|
When you look at a 3D chart on a computer screen or a printed piece of paper, you are looking at an object that is specially drawn to give a 3D appearance in a 2D plane. Projection is a mathematical process used to display a 3D chart in a 2D plane. The following table describes the various types of projection.
Projection |
Description |
|---|---|
Oblique |
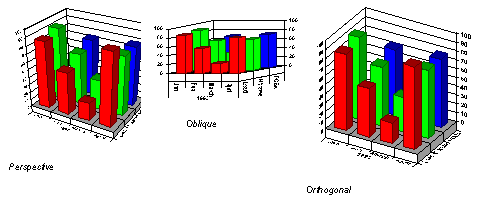
This is sometimes referred to as 2.5 dimensional. The chart has depth, but the XY plane does not change when the chart is rotated or elevated. |
Orthogonal |
Perspective is not applied to the chart. The advantage of using this type of projection is that vertical lines remain vertical, making some charts easier to read. |
Perspective |
This provides the most realistic 3D appearance. Objects farther away from you converge toward a vanishing point. |
Important Surface charts will not display with oblique projection. If the Oblique projection type is selected for a surface chart, an orthogonal projection will be substituted instead.
The following illustration shows the same chart drawn using different projection methods.

You can change the chart projection in the Chart Designer from the 3D View tab of the Plot menu item.