Displaying wireframe surfaces |

|

|
|
Displaying wireframe surfaces |

|

|
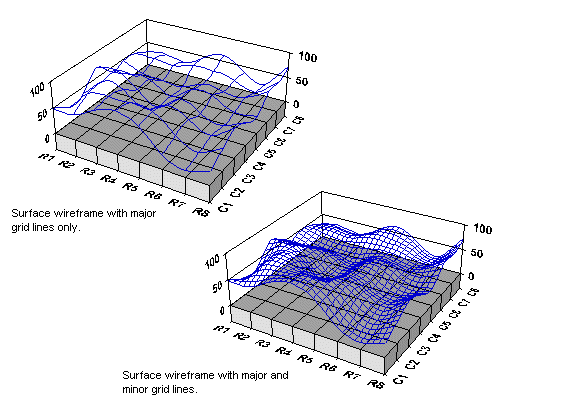
If you choose not to display a surface on your 3D surface chart, the chart utility will represent the surface with a wireframe. Surface wireframes can be displayed through variations in pen colour and the interval at which the wireframe iterates, along the charts surface. The following table lists the wireframe options available on the Elevation tab:
Type |
Description |
|---|---|
None |
The surface is represented by the surface colour only. |
Major |
The wireframe indicates the original data grid values. |
Major and Minor |
The wireframe is drawn upon the surface along the original data grid values and any additional rows or columns generated by the smoothing process. |
The following illustration shows several wireframe surface charts.
