Displaying contour chart colours |

|

|
|
Displaying contour chart colours |

|

|
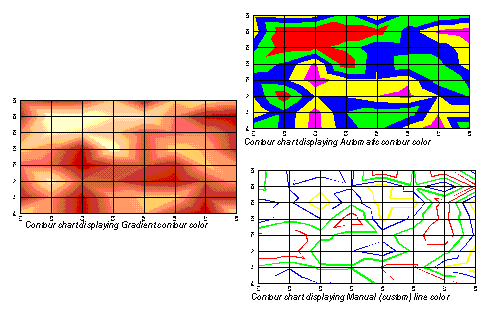
There are three ways to display colour on a contour chart. You can make the following choices from the Colors drop down menu on the Contours tab.
Type |
Description |
|---|---|
Automatic |
The contour colours are displayed as the default series colours. |
Gradient |
The contours are displayed in an even transition of two colours. |
Manual |
Custom contour colours can be specified and modified by the user. (Manual colours is only available when the Automatic Values checkbox is deselected.) |
The following illustration demonstrates the three colour types for contour charts:
