Formatting guidelines |

|

|
|
Formatting guidelines |

|

|
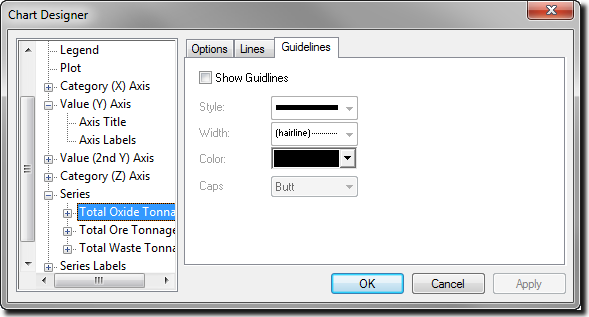
Use the Guidelines tab for each series to control the display and format of guidelines for the series in 2D and 3D line, area, and step charts, as well as bubble charts, 3D xyz and scatter charts.

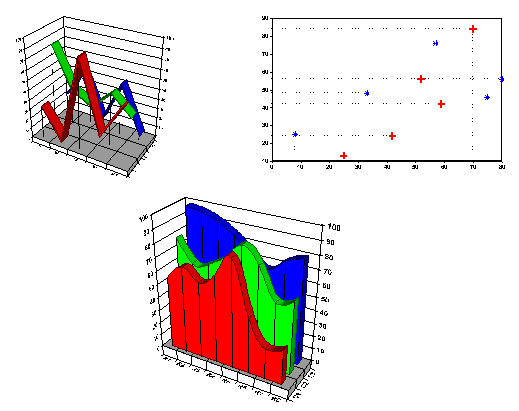
Guidelines are lines that are drawn from a data point to one or more axis to better identify the data point position. The following illustration shows guidelines on several types of charts.

Related topics |