Formatting data points |

|

|
|
Formatting data points |

|

|
By default, each data point in a series has the same format. However, there may be times that you want to highlight one or more data points in a series by changing their format.
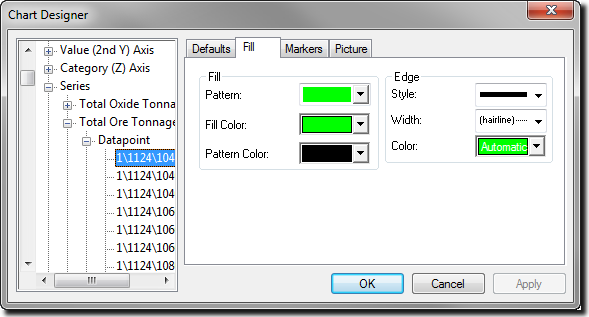
Each individual data point has an entry in both the Datapoint and Datapoint Labels menus. This example below shows the expanded Datapoint menu on the Chart Designer tab:

Related topics |