Schedule Status plot |

|

|
|
Schedule Status plot |

|

|
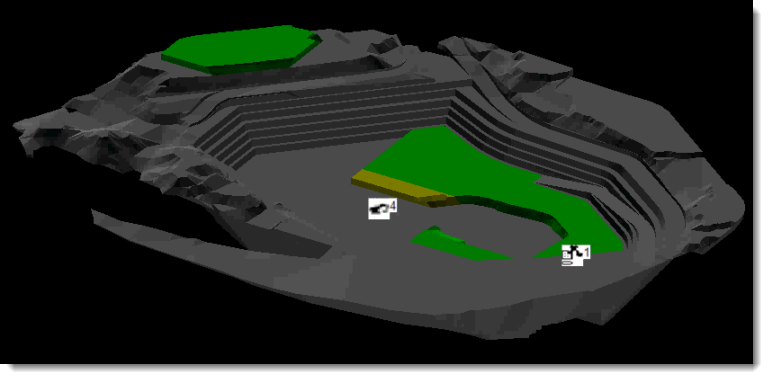
Use a Schedule Status plot to display the state of each block in your mine according to the mining rules that you have set up. This lets you visualise the availability of each block as the schedule progresses. You can use this type of plot to debug your schedule and understand why certain blocks are not being mined, for example, if a proximity constraint is preventing access.
XPAC shades each block in the plot according to its status (you cannot change the default shading settings):
Status |
Description |
|---|---|
Unavailable |
The block is not available for mining (i.e. its dependencies have not been satisfied). |
Available |
The block is available to be mined (i.e. its dependencies have been satisfied). |
Constrained |
The block does not have any dependencies, but is constrained by a mining rule. |
Current |
The block is currently being mined. |
|
When you generate a Schedule Status plot, XPAC runs the schedule at the same time as the plot. As such, XPAC prevents you from accessing any other part of the system while you are viewing the plot, for example, you will not be able to change details in the schedule. RPM recommends running the schedule after displaying this type of plot (for example, if you skip between schedule periods, the schedule may not be complete). |
After generating a Schedule Status plot, you can use the Schedule Status Time Controls to view the plot during any point in the schedule (for example, you can play, pause and skip to a specific point in the schedule).
