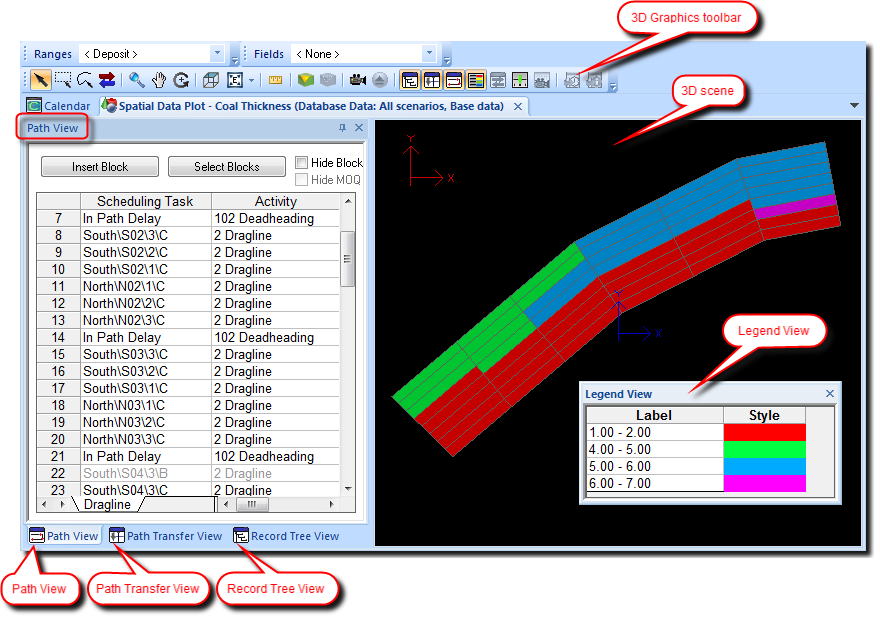
The Spatial Data Plot window |

|

|
|
The Spatial Data Plot window |

|

|
The Spatial Data Plot window contains the tools that you need to manage spatial data plots (for example, you can create, use and manage plots). The tools that you need are available from the following toolbars, views and windows in the Spatial Data Plot window:

The tools in the Spatial Data Plot window let you perform a variety of interactive tasks, for example, you can:
To open the Spatial Data Plot window:
| 1. | Either: |
| a. | Click Display Spatial Data Plots on the Tools toolbar; or |
| b. | Select View > Spatial Data Plots. |
| 2. | In the window that displays, either: |
| a. | Double-click the name of a plot to view an existing plot that you created. The plot displays in the 3D Scene. |