Specifying the annotation using the field expression field |

|

|
|
Specifying the annotation using the field expression field |

|

|
Specifying the annotation using the field expression field |

|

|
|
Specifying the annotation using the field expression field |

|

|
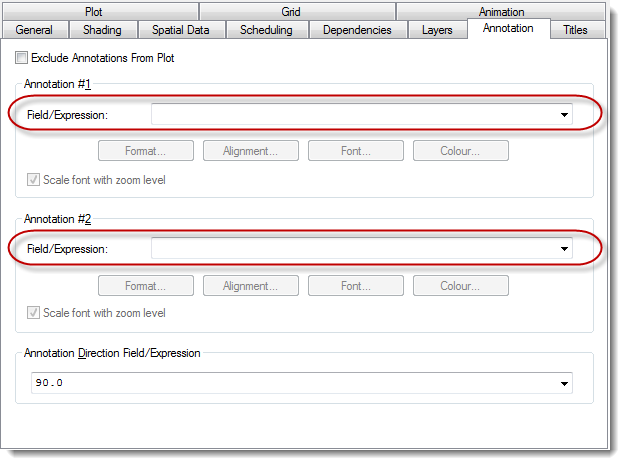
You can use the Field/Expression field/s in the Annotation tab to specify up to two annotations for each block in a spatial data plot:
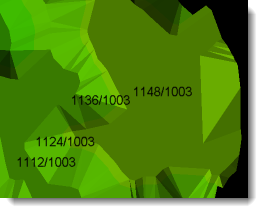
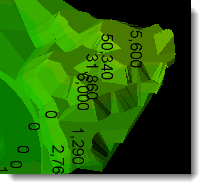
Annotations are typically used to display data field values and/or record names, for example:
You can either:
Select a database field from the Field/Expression drop-down list to determine the annotation/s that XPAC displays on the spatial data plot. For example, if you select Imported Insitu Coal Thickness, XPAC displays this database value for each block in the plot.
You can also type an expression into the Field/Expression drop-down list to specify the annotation that displays in the plot. You must use an expression that returns a value or string for each record in the plot range. If the range that you are using in the plot refers to upper level records, then XPAC displays values for upper level records.
|
The Field/Expression field also lets you use XCM functions or commands, provided you can fit it on a single line. |
See Annotation expression examples for more information.
A conditional expression returns one of two values, based on whether a condition is true or false.
|
You can use the IIf function to use a conditional expression (instead of using an If...Then...Else...End If control structure, which requires you to create a data field and write an XCM). |
You can use the following general format to produce a conditional expression:
IIf(Condition, Value if Condition True, Value if Condition False)
| • | Condition is an expression which returns either a True or a False |
| • | Value if Condition True is the value to return if the Condition returns a value of True |
| • | Value if Condition False is the value to return if the Condition returns a value of False. |
|
The Value if Condition True and Value if Condition False must both return a valid expression. Both are evaluated, even if only one of them is returned. |
See Annotation expression examples for more information.
The Annotation Direction Field/Expression field lets you specify the orientation of the annotation text. You can either:
| • | type an expression; or |
You can specify the direction of the annotation text that displays in a spatial data plot by typing an angle value into the Annotation Direction Field/Expression field:
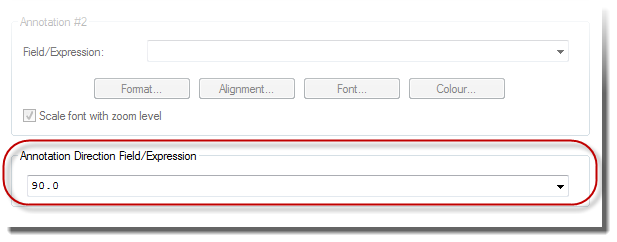
For example, you can display annotations in a normal text direction by typing 90 into the Annotation Direction Field/Expression field:
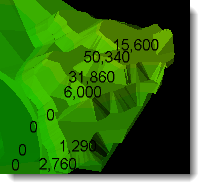
Otherwise, you can specify any other angle to display text in a particular orientation. For example, to display annotations in a downwards-facing direction, type 180 into the Annotation Direction Field/Expression field:
|
By default, XPAC assumes a normal text direction.
|