Working with analysis report expressions |

|

|
|
Working with analysis report expressions |

|

|
When creating a report, the standard data fields may not let you set up your report the way you want to. For example, you may want to change the way data displays (that is, you might want to restrict the result to a certain number of significant figures, or display it in a different colour) or create a weighted average.
Analysis reporting lets you create both additional calculated fields for doing mathematical calculations on the raw data and new measures to point to the new calculated fields. While you can create mathematical formulae within the expression field of a measure, measures cannot reference other measures, only calculated fields.
RPM recommends performing all data calculations by creating additional calculated fields. You can then create new measures to reference these calculated fields, and set the data formatting and data aggregation rules. This will become more important as the complexity of your formulae increase.
You can use the expression builder to develop new attributes, measures and fields, based on the data you imported from your XPAC project.
See Working with analysis report measures for more information.
To open the measure expression builder, either:
| • | right-click anywhere in the Measures pane and select Create New Measure; or |
| • | right-click the measure you want to edit and select Edit Measure. |
If you select to create a measure, the expression builder is empty. If you select to edit a measure, the expression builder displays the existing measure data pre-populated.
The left pane lists all the available query fields, which include:
| • | all the data rows you imported originally |
| • | the data rows imported or created by analysis reports as a result of the report type you selected |
The left pane does not contain any new measures that you create.
Complete the following fields to define your measure:
The caption will display in the Measures pane of your report as the display name of your new measure. You can edit the caption of an existing measure which does not change its database name or full row code.
The folder in the Measures pane in which your new measure will be available. You cannot edit the display folder of an original measure, but you can edit the display folder of a measure you have created.
Use this field to define the way the measure will display in your table of values, or as an axis in your chart or graph. Click Browse to open the Format dialog box. Select the Category for the format, then select the exact format type.
Use the drop-down list to select the aggregate function you want to use for your expression. The aggregate field describes the manner in which analysis reports will aggregate multiple instances of the field. For example, you might have a field that contains the number of days lost to rain in a month and each month would have a value. The aggregate function describes how those values for months are aggregated to form (for example) the values for quarters and years. The available aggregate functions are:
| • | Additive: this function adds values to form the aggregate value. |
| • | Average: this function takes the average of all field values to form the aggregate value. |
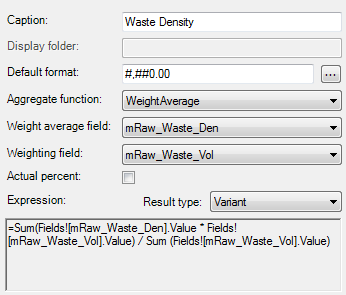
| • | WeightAverage: the weighted average corresponds directly to the weight average function in XPAC. In analysis reports it is a special type of calculated field. If you select WeightAverage, you can access the following drop-down list and check boxes: |
| ▪ | Weight average field: this should be a qualitative field. In the example below for the Waste Density measure, this is the raw waste density. |
| ▪ | Weighting field: this should be a quantitative field. In the example below for the Waste Density measure, this is the raw waste volume. |
| ▪ | Actual percent: this check box corresponds to the actual percent mined, wasted or scheduled. Select the check box to have the measure you create return the actual per cent, deselect it to return the available total. |

You can update the expression for your weighted average by making changes to the Weight average field and Weighting field drop-down lists, and the Actual percent check box. Analysis reports will automatically update the expression for you.
|
If you create a new measure, you can edit the expression for the weighted average if necessary. However, a better method would be to create the weighted average as a calculated field by developing the expression as a new measure, then copying and pasting it into the calculated fields expression builder.. |
| • | Min: if you select this aggregate function, any time this measure is aggregated, it will return the minimum value from all the values available. |
| • | Max: if you select this aggregate function, any time this measure is aggregated, it will return the maximum value from all the values available. |
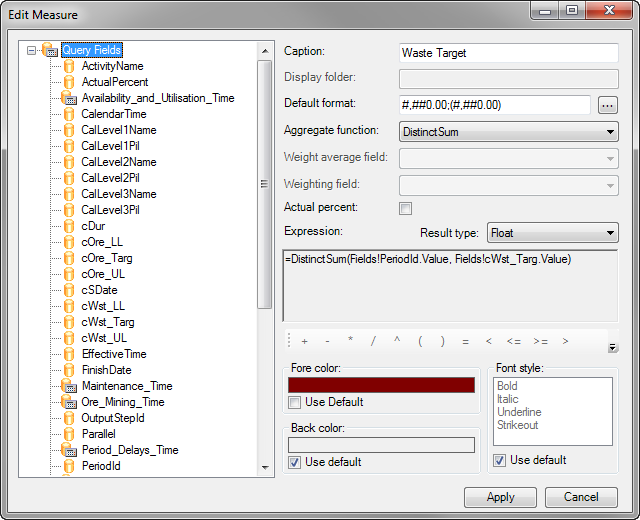
| • | DistinctSum: use this aggregate function to deliver the sum of distinct data points, for example, waste targets. In every calendar period, you have a waste target for every action in that period. Hundreds of cells in that period might have the same waste target. When you aggregate the calendar periods into a full year, you do not want to add every waste target entry, you would be adding the same thing hundreds of times. Instead, you need to take one value for each period. |
In the following example, the Waste Target measure has been created by using the period ID value to distinguish waste target values:

Note that you need to use the DistinctSum expression when you want to create a measure that aggregates using the DistinctSum function. See Expression below for more information.
This function is most useful in schedule reports, but you can use it in other reports as well.
| • | Calculated: use this aggregate function to move the aggregation process to the expression. You can use this function when you do not want analysis reports to aggregate your values, but want to create your own aggregation function with an expression. Instead of aggregating, each instance of a calculated measure delivers the same value. |
You can create almost any expression using the query fields, the expressions toolbar and the Visual Basic syntax and functions available in the Microsoft.VisualBasic assembly.
For more information about Visual Basic syntax and functions, see http://msdn.microsoft.com/en-us/library/microsoft.visualbasic.aspx.
The exceptions are as follows:
| • | DistinctSum: you must use the DistinctSum() function when defining a measure with a DistinctSum aggregation type. |
| • | Calculated: there are a limited number of functions available for defining a measure with a calculated aggregation type, which include Sum, Avg, StDev, StDevP, Var, VarP, Median, Mode, Min and Max. You can also use DistinctSum and AggregateIf functions with the Calculated aggregate function in expressions for measures. Other options may exist but have not been tested. |
The result type you select will determine how analysis reports treats the measure. For example, analysis reports will assume a String result type will contain numerical data and will not let you set the data set as continuous in the Pivot Grid (see Working with data in the Pivot Grid for more information).
If you are unsure of your result type, set it to Variant. This will let you use the data set in any way, without restriction, but may cause your reports to take longer to run.
Valid expression result types include:
| • | Integer: non-decimal numbers |
| • | Float: single precision binary floating-point numbers |
| • | Variant: union of other fixed types |
| • | VariantArray: collection of variants |
| • | String: sequence of characters |
| • | Boolean: displays True or False |
| • | DateTime: a date and time value using a .NET format |
| • | Binary: machine code. |
After you save, XPAC will perform a validation check on the field to make sure the nominal output matches the result type. If it does not, XPAC will change the result type to Variant.
You can select from the following operators to build your expression:
![]()
|
Some screen resolutions will not display all operators by default. If your screen does not display all the above operators, you can use the down arrow to the right of the bar to access the remaining tools, or increase the size of the expression builder window. |
You can use these fields to change the colour and style of the output text.
| • | Fore color - either: |
| ▪ | Select the Use Default check box to use the default settings; or |
| ▪ | Deselect the Use Default check box and click the colour bar to select a new colour. |
| • | Back color - either: |
| ▪ | Select the Use default check box to use the default settings; or |
| ▪ | Deselect the Use default check box and click the colour bar to select a new colour. |
| • | Font style - either: |
| ▪ | Select the Use default check box to use the default settings; or |
| ▪ | Deselect the Use default check box and select the font style from the list. You can select more than one style by pressing and holding Ctrl while selecting multiple styles. |
This section applies to both attributes and levels, though adding an attribute to a dimension with a hierarchy will not create a new level and adding a new level to a hierarchy will not create a separate attribute.
See Working with analysis report attributes for more information.
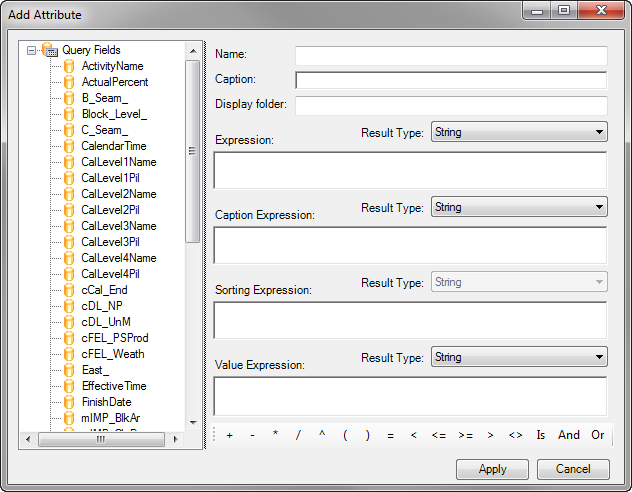
To open the attribute expression builder, either:
| • | right-click the dimension to which you want to add an attribute and select Add Attribute; or |
| • | right-click the attribute you want to edit and select Edit Attribute. |
If you select to add an attribute or level, the expression builder is empty. If you select to edit an attribute or level, the expression builder displays the existing attribute data pre-populated.

The left pane lists all the available query fields, which include:
| • | all the data rows you imported originally |
| • | the data rows imported or created by analysis reports as a result of the report type you selected |
The left pane does not contain any new attributes that you create.
Complete the following fields to define your attribute.
This field is not available in the analysis report. The purpose of this field is to record the origin of the source data. As a result, it has more meaning for attributes that were created with the report than user-added attributes.
The caption will display in the Attributes pane of your report as the display name of your new attribute. You can edit the caption of an existing attribute.
The folder in the Attributes pane in which your new measure will be available. Unlike measures, you can edit the display folder for any attribute.
The section on the measures expression builder above covers expressions and result types. In the attribute expression builder, expressions and result types work in the same way, except there are four different expressions available for each field:
| • | Expression: this is the default expression that returns the discrete value for the attribute. If either the Caption Expression or Sorting Expression field is left blank, analysis reports will substitute this expression. This is a required field. |
| • | Caption Expression: this expression defines the table, chart or graph caption for the attribute. A caption will display only if Expression returns a value. If this expression is left blank, analysis reports will substitute Expression. |
| • | Sorting Expression: this expression defines the value for the attribute that analysis reports will use to sort the attribute. If this expression is left blank, analysis reports will substitute Expression. |
| • | Value Expression: this expression returns the continuous value for the attribute and is rarely used (see Continuous or discrete data for more information). |