Navigating in analysis reports |

|

|
|
Navigating in analysis reports |

|

|
|
You need to run and complete a scenario in XPAC before you can make use of analysis reports. |
To open an analysis report:
| 1. | Select View > Analysis Reports. The Analysis Reports window displays. |
| 2. | Select a report from the list of reports. |
| 3. | Click Select to open the selected report. |
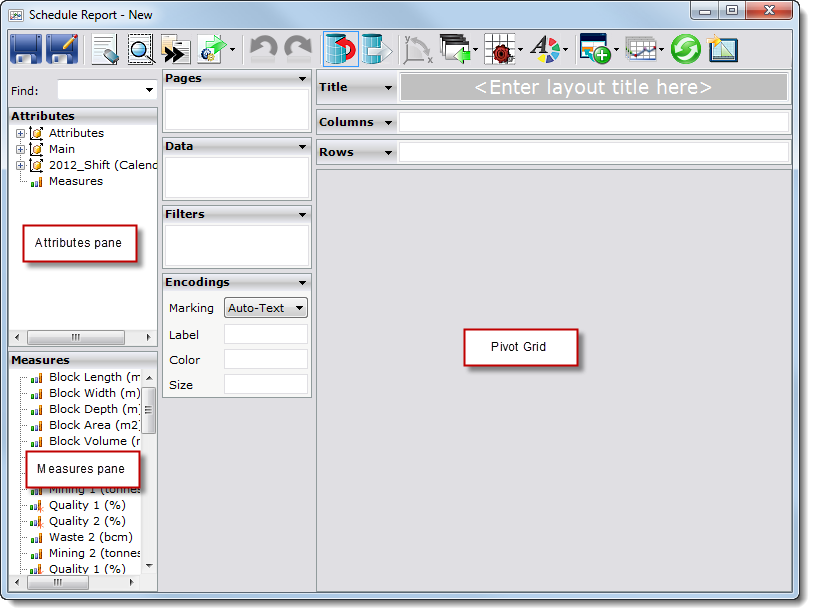
In the Design mode, the reports window is constructed of up to seven panes, a toolbar and a Find field.
In the Viewer mode, the display is restricted to the Title, Description and Summary cards (if selected) and the Pivot Grid.
|
You can switch between modes by clicking Switch Designer Mode. |
Three panes (Attributes, Measures and Pivot Grid) contain information as a result of choices you have made to set up the report, or will make as part of the process of producing the report. You cannot choose to display or hide these panes, though the Attributes and Measures panes will not display in Viewer mode.

The Attributes pane contains information about the XPAC project and its hierarchy of levels (derived from the pit design), as well as calendar information covering the period of the scenario. You can define the report output by dragging and dropping attributes from the Attributes pane onto the card shelves.
Related topic |
The Measures pane contains information about the measures you selected to import when you created the analysis report. You can define the report output by dragging attributes from the Measures pane and dropping them onto card shelves.
Related topic |
The Pivot Grid displays the results of your defined queries. Dragging and dropping attributes and measures onto card shelves will update the Pivot Grid.
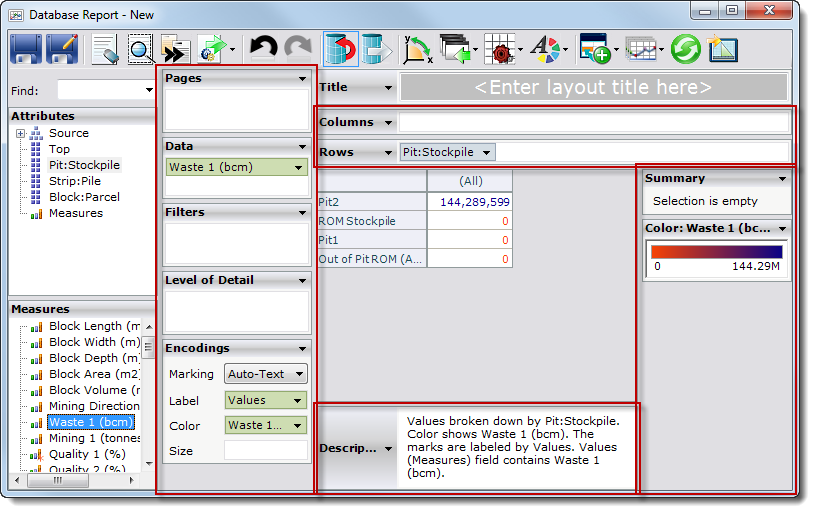
The remaining four panes contain cards. These panes display above, below and to either side of the Pivot Grid.

By default, only the left and top panes display as populated when you start analysis reports.
You can use the cards to arrange information on the report to your preferences, by dragging and dropping attributes and measures to a card's shelf.
You can add most items (attributes or measures) to any card. Some cards will only become available as you drag and add inputs (attributes or measures) to existing cards. For example, if you drag an item from the Attributes pane to the Pages card, the Current Page card will display to the right of the Pivot Grid. You could leave this card on that pane, or drag & drop it to any other card pane.
Other cards are restricted to certain card panes. For example, you can activate the Title, Description and Summary cards at any time from the Cards drop-down list, but the Title card may only display on the top card pane and the Summary card may only display on one of the side panes.
Choose which item to display on each card by choosing from the Attributes and Measures panes and then dragging and dropping that item onto the destination card's shelf. If you clicked Auto query to turn this function on, the Pivot Grid immediately updates to display the new data selection.
Related topic |