XPAC lets you animate a spatial data plot so that you can visualise the mining process and identify flaws in your schedule. During a plot animation, XPAC runs the schedule so that you can see each resource mining blocks in its path. For example, an animation may allow you to recognise defects such as:
| • | schedule conflicts (for example, 'underground' mining in a surface operation) |
| • | equipment in close proximity |
| • | incorrect mining direction. |
Setting up and running a spatial data plot animation
| 1. | Run the schedule for the active scenario. |
| a. | a Database plot if you want to animate one activity; or |
| 3. | Specify the animation speed settings in the Animation tab of the plot's window. |
| 5. | Load paths that you want to display in the animation. |
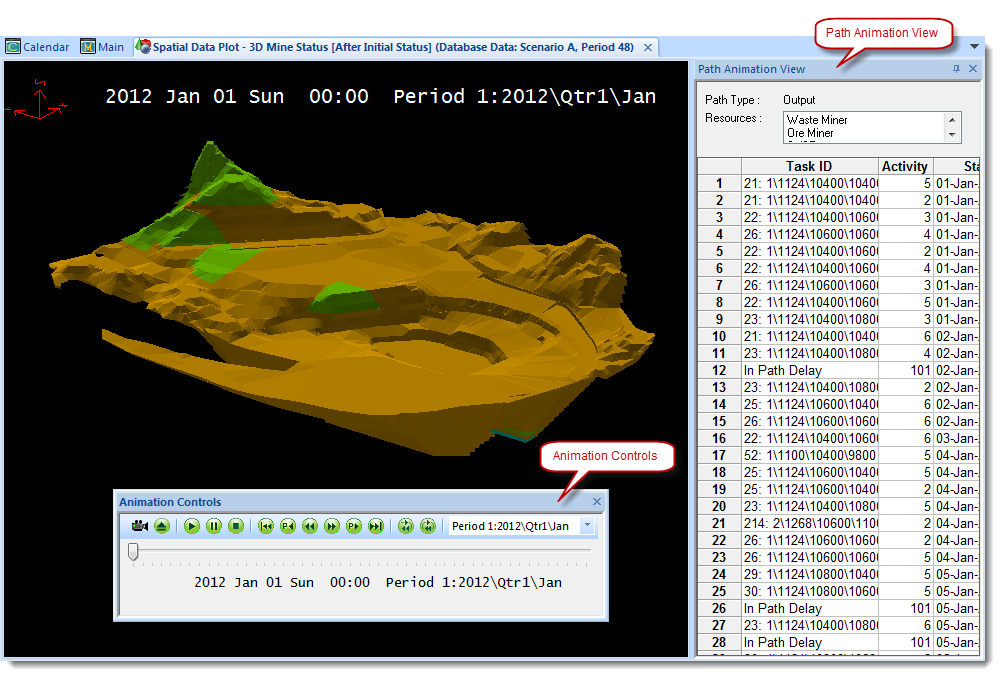
XPAC redisplays the 3D Scene and automatically opens the Animation Controls and Animation Path View so that you can control the playback of the animation:

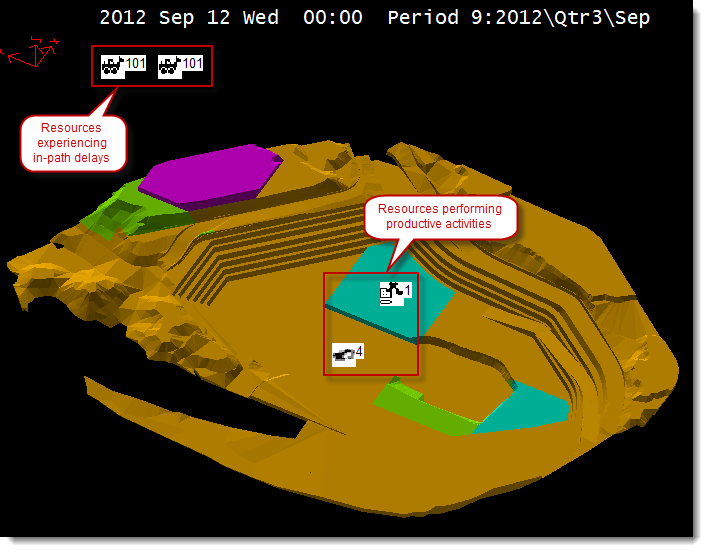
When you start the animation, XPAC uses the animation sound and resource icon that you previously specified. The 3D Scene also displays schedule information as the animation runs, for example, the date, time and period. During the animation, XPAC displays resources that are performing productive activities in the respective area of the mine, and resources that are experiencing in-path delays outside of the mine, for example:


|
You can specify the details that display next to resource icons by using the settings in the Animation Icon Annotation section of the tab.
|


